Overview
Reporting Apps give users the ability to run analytics on their IT environment. Users can see a breakdown of their IT assets by resource type and a server distribution based on utilization. Reports from Reporting Apps are now available in PDF and XLSX formats.
Below are the key features of Reporting Apps:
- See analytics in a browser: The user is able to see the analytics report in a browser.
- Download analytics: Users can export analytics reports in PDF or XLSX format and view them offline.
- Re-run analysis: The user’s environment changes on a daily basis. As a result, environmental analysis varies on a daily basis, and whenever users want to get the most recent data they can re-run the same analysis.
- Run analysis on a schedule: For the user’s large environment, users can schedule to run analysis as needed and see the reports every day after logging in to the system; there is no need to wait for more time to run analysis and download the report.
- Send analysis on a schedule: Send analysis to the tenant’s own users.
Note
- Since the run is private to a particular user, only the individual who initiated it can view the run from the list. Users are unable to view any other users runs.
- Only the top 10 individual runs and analysis user runs will be shown on the API/UI page list.
- Purging Activity: It runs at
10:00:00 am, every day starting on the 1st of every month. - If a report contains a large amount of data, it will take some time for the tabular data to appear in the UI page.
Prerequisites
- Users required administrator level permissions to install and uninstall the reporting apps.
The following messages used in the UI are listed below.
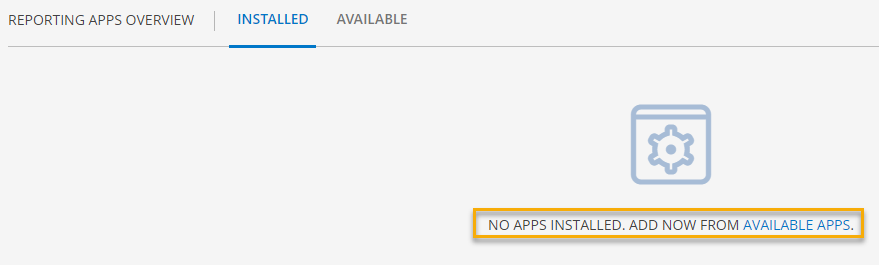
- You will see the following message on the Installed page, if no apps are installed or if all of the apps are uninstalled.
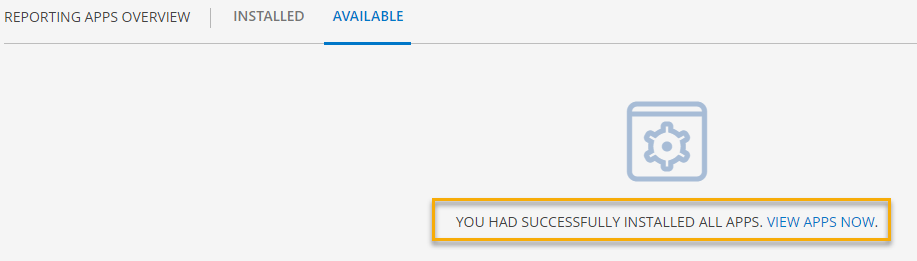
- You will see the following message on the Available page, if all the apps have been installed.
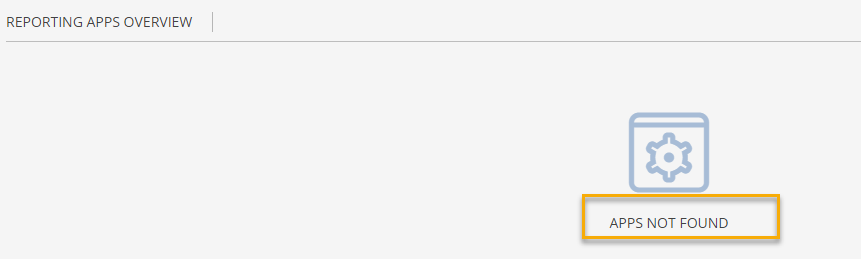
- You will see the following message, if any apps are not supported to a specific Tenant scope.
Types of Reporting Apps
Below are the types of supporting applications listed under the Reporting Apps.
- Alert Listing
- Asset Insights
- Asset Inventory
- Metered Usage Insights
- Network Utilization
- OPS 360 for Patching
- Process Definition Insights
- Remote Control Usage
- Software Inventory
Specifications of Apps
This section describes the purpose of each app, the supported formats, analysis periods, and other limitations.
Alert Listing
- Description: Once you configured this app you are able to see a detailed list of alerts.
- Configuration Parameters:
- Query: Using an OpsQL query, you can customize the report result. If users did not select “updatedTime” attributes in the query string, in that case the user selection query would be appended by default.
For example: If a user only selects the alertType attributes, the query will automatically append withAND updatedTime > '-7d'
The query will look like below:
(alertType = “MONITORING”) AND updatedTime > ‘-7d’ - Select Attributes: Only selected attributes related data will be included in the report. If no attributes are selected, the default attributes data will be included in the report.
Note
The UI page will only display the first 10 selected attributes from the configuration parameter section for the run results. This is due to better UI representation. If you want to see all of the selected attributes (more than 10), then download and open the run report in excel format.
- Query: Using an OpsQL query, you can customize the report result. If users did not select “updatedTime” attributes in the query string, in that case the user selection query would be appended by default.
- Format: Reports are generated in XLSX format.
Asset Insights
- Description: This application gives users inventory information of their managed devices and also, you will be able to see the trends and breakdowns of your IT assets. For example: Total managed resources, Top managed resources.
- Configuration Parameters:
- Analysis Period: Only support Snapshot option to analyze the report.
- Formats: Reports will be generated in PDF and XLSX formats.
Asset Inventory
- Description: Once you configured this app you are able to see a detailed list of your resources.
- Configuration Parameters:
- Query: Using an OpsQL query, you can customize the report result. If users did not select “state” and “monitorable” attributes in the query string, in that case the user selection query would be appended by default with “state” and “monitorable” attributes.
For example: if a user only selects the clientid attributes, the query will automatically append state = ‘active’ AND monitorable = true
The query will look like as below:
(clientId = “client xxxxxx”) AND state = ‘active’ AND monitorable = true - Select Attributes: Only selected attributes related data will be included in the report. If no attributes are selected, the default attributes data will be included in the report.
Note
The UI page will only display the first 10 selected attributes from the configuration parameter section for the run results. This is due to better UI representation. If you want to see all of the selected attributes (more than 10), then download and open the run report in excel format.
- Query: Using an OpsQL query, you can customize the report result. If users did not select “state” and “monitorable” attributes in the query string, in that case the user selection query would be appended by default with “state” and “monitorable” attributes.
- Format: Reports are generated in XLSX format.
Metered Usage Insights
- Description: This application shows you your OpsRamp usage over the metering period. For example: Total unweighted devices, weighted devices.
- Configuration Parameters:
- Analysis Period: Supported analysis periods are: Current Period, Last Period, Specific Period.
- Formats: Reports will be generated in PDF and XLSX formats.
Example of current period:
- Current time :math:=10:00 AM UTC, July 31.
- Current period: 12:00 AM UTC, June 1 - to 11:59 PM UTC, June 30
- Current period: 12:00 AM UTC, July 1 - to 10:00 AM UTC, July 29.
Example of last period:
- Current time :math:=10:00 AM UTC, July 31.
- Last period: 12:00 AM UTC, June 1 - to 11:59 PM UTC, June 30
- Current period is the month of July.
- Last period is the month of June.
Example of specific period:
- The specific period given the user is May, 2022.
- Specific period: 12:00 AM UTC, May 1, 2022 - to 11:59 PM UTC, May 31, 2022.
- Current time: 11:55 PM UTC, July 31, 2022.
Network Utilization
- Description: This is a fairly standard Top 10 report for CPU Utilization, Memory Utilization, and Interface Utilization for Cisco devices. It displays a time series for the Top 10 items only, followed by a detailed report for all items.
- Configuration Parameters:
- Analysis Period: Supported analysis periods are: Last 24 hours, 7 days, 3 months, 6 months, and specific period.
- Formats: Reports are generated in PDF and XLSX formats.
OPS 360 for Patching
- Description: This application provides an overview of patch management once you configured this app.
- Configuration Parameters:
- Select Category: This application supports patch category as- Critical, Security, Feature Packs, Update Rollups, and Updates.
- Analysis Period: Supported analysis periods are: Last 24 Hours, Last 7 Days, Last Month, Last 3 Months, and Specific Period.
- Formats: Reports are generated in PDF and XLSX formats.
Process Definition Insights
- Description: This app provides insights of process definition, details of each process definition, and its instances.
- Configuration Parameters:
- Analysis Period: Supported analysis periods are: Last 24 Hours, Last 7 Days, Last Month, Last 3 Months, and Specific Period.
- Start Event Type: You can select the types of event (single/multiple/all options) from the list.
- Start Event Object Type: You can select the types of event object (single/multiple/all options) from the list.
- State: Choose state of run (single/multiple/all options) from the list.
- Format: Reports will be generated in PDF and XLSX formats.
- Configuration Parameters:
Remote Control Usage
- Description: Once you configured this app you can see a detailed list of remote control console sessions that occurred in the reporting period.
- Configuration Parameters:
- Analysis Period: Supported analysis periods are: Last 24 hours, 7 days, 3 months, 6 months, and specific period.
- Formats: Reports will be generated in PDF and XLSX formats.
Software Inventory
- Description: Once you configured this app you can see a detailed list of installed Applications and Services for each device.
- Configuration Parameters:
- Analysis Period: Only support Snapshot option to analyze the report.
- Formats: Reports will be generated in only XLSX format.
Installation of Reporting Apps
Follow the below steps to install any of the Reporting Apps:
- Go to Reports > Reporting Apps Overview.
- Click the Available tab to see all the available Reporting apps.
- Click ADD to install the required Reporting app.
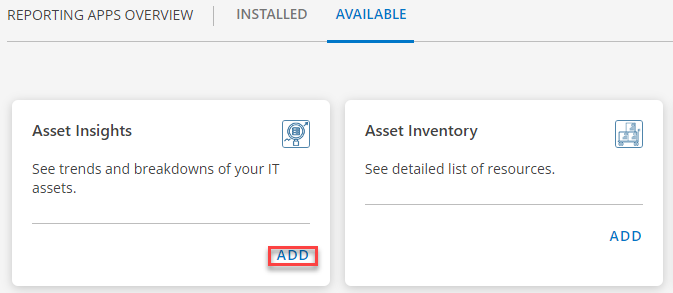
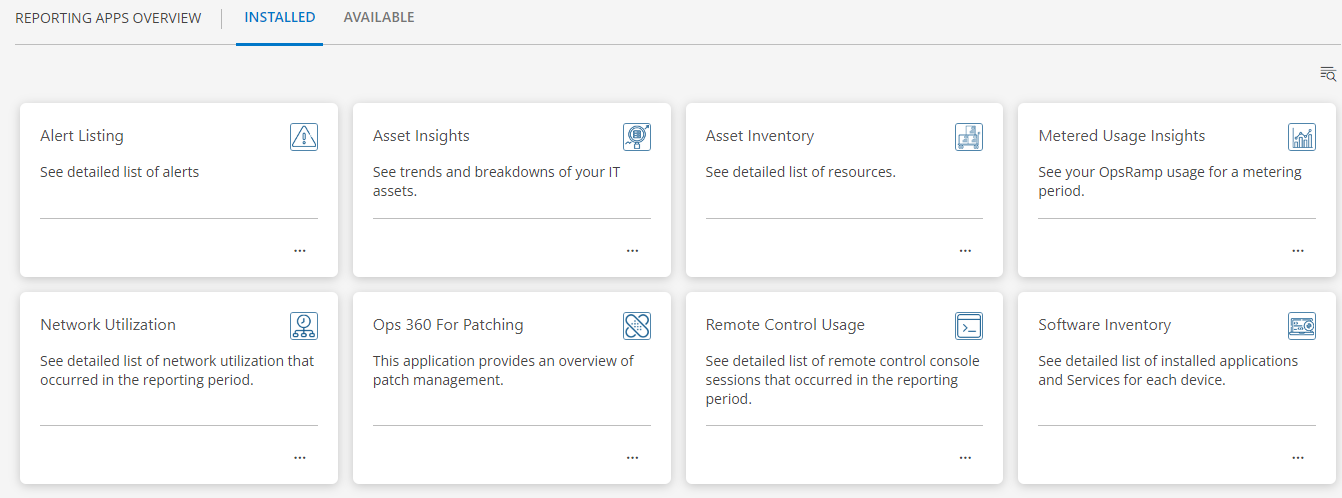
- Now, if you want to see the installed apps click the Installed tab.
Configurations of Reporting Apps
Configuration process is the same for all the apps except for a few minor changes, so given examples for two different types of apps to configure with all the required steps.
Before you start configuring the apps, make sure you have installed the specific apps from the Available tab.
Example-1: Asset Insights
To configure the Asset Insights app, follow the below steps:
- Go to the Installed tab.
- To configure the Asset Insights app, click on the app card to open it.
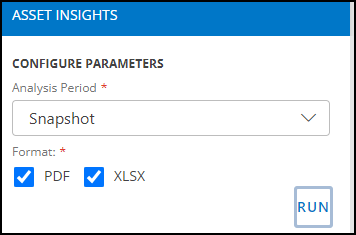
- In configuration Parameter section:
- Analysis Period: Default analysis period as Snapshot is selected.
- Format: Choose the format (PDF or XLSX) of your report to be generated.
- Once you have selected the configuration parameters, click Run.
Example-2: Alert Listing
To configure the Alert Listing app, follow the below steps:
- Go to the Installed tab.
- To configure the Alert Listing app, click on the app card to open it.
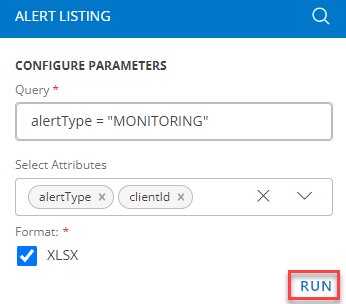
- In configuration Parameter section:
- Add Query: Using an OpsQL query, you can customize the report result. If users did not select “updatedTime” attributes in the query string, in that case the user selection query would be appended by default. For example: If a user only selects the alertType attributes, the query will automatically append with AND updatedTime > ‘-7d’ The query will look like below: (alertType = “MONITORING”) AND updatedTime > ‘-7d’
- Select Attributes: Only selected attributes related data will be included in the report. If no attributes are selected, the default attributes data will be included in the report.
- Format: Choose the format (XLSX) of your report to be generated.
- Once you have selected the configuration parameters, click Run.
Save the Configured Analysis
This section describes how to save the configured Apps. Procedure to save the analysis is the same for all the apps.
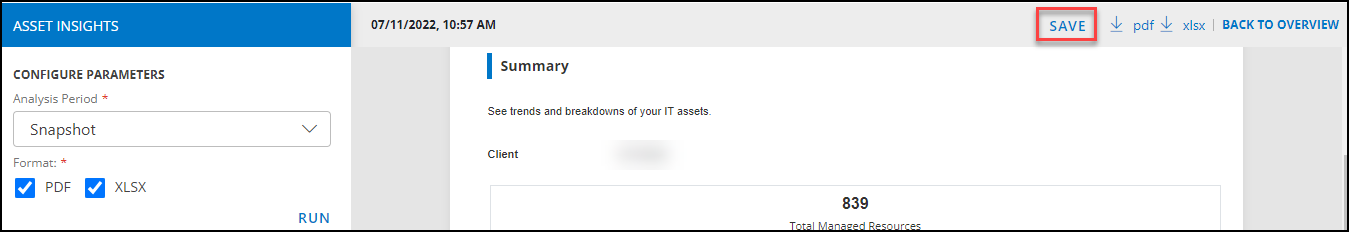
- Once run has successfully completed, you will be able to save and download the report in (PDF and XLSX) format.
Note
Only completed runs will have an option to Save the runs as analysis, runs that are still in progress, running, or failed you will not have option Save it as analysis. To see the status of your run, click the Recent button.- To save your run as analysis, click the Save button.
Next, fill in the following details in the Save as Analysis page:
- Analysis Name: Give the name to your analysis. When giving a name to an analysis, make sure it is unique and not duplicated for the same type of app at user level.
- Run on Schedule: If you want to schedule your run, enable this option and configure the following fields. (This is optional)
- Daily: Select this option to run your analysis on a daily basis and can configure by choosing the available time preference.
- Weekly: Select this option to apply to run your analysis on a weekly basis. Configure weekly schedule by selecting the available time preference.
- Monthly: Select this option to apply to run your analysis on monthly wise only. Configure this by selecting the number of days in a month.
- Recipient Users: Select the users from the list to send the report notification.
- Message: You can add your message here, if not added anything the system will send with a default message subject. Date and time in subject is referred to completion of time.
Examples of default message
- Example 1: Metered usage run: Tuesday, June 21 18:05:05 PDT 2022 attached.
- Example 2: Assets insights run: Tuesday, June 21 18:05:05 PDT 2022
- Set Time Zone: You can run the schedule in a specific time zone. When you choose a time zone, it ignores the different local time zones and uses the time zone specified in the configuration.
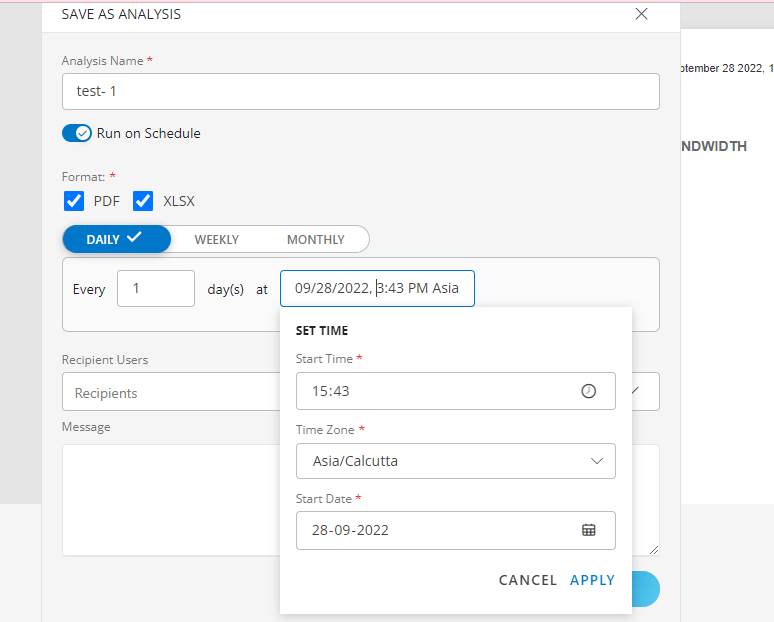
- Finally, click the Save button to finish. You can find your saved analysis under the Analysis section.
- Click Back To Overview at the upper right corner to return to the Overview page.
View the Saved Analysis
This section describes how to modify the saved analysis and where to find the most recent run progress.
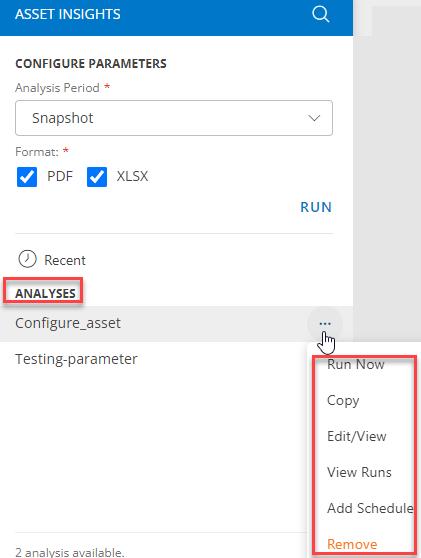
You will have the following options to take action against each saved analysis:
- Run Now: Use to run the individual analyses again.
- Copy: Use this option if you want to duplicate this analysis.
- Edit/View: This option allows you to view or edit the configure parameters.
- View Run: Click to see the current status of the run.
- Add Schedule: This option allows you to add and configure a schedule period for the analysis to run.
- Remove: Use this option to delete an analysis from the list if it is no longer relevant.
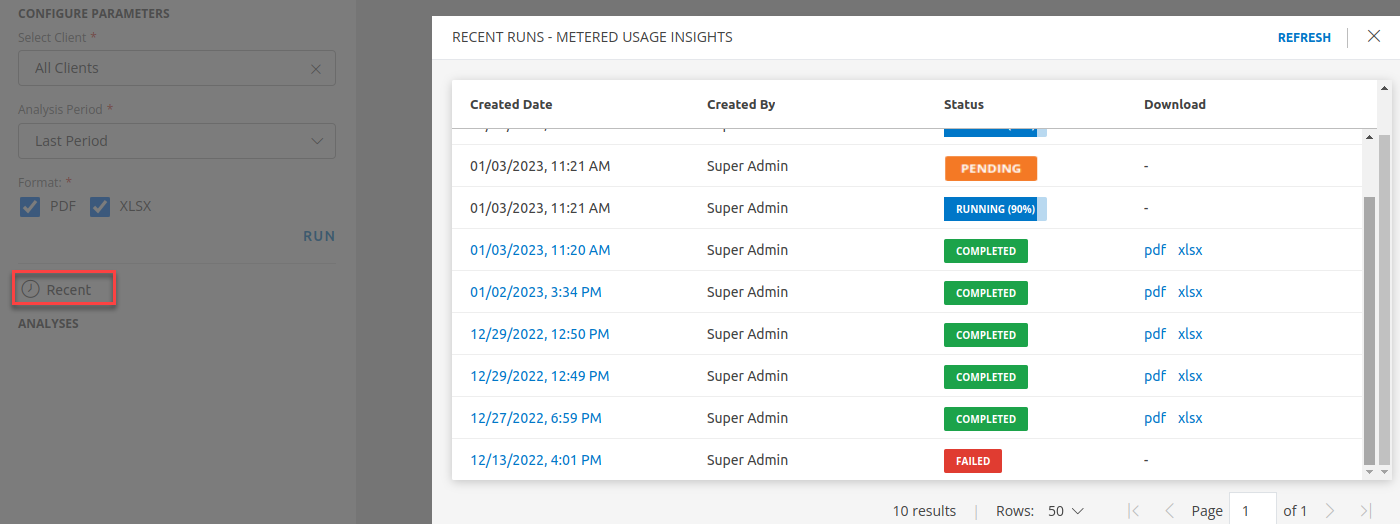
To see the status of your run, click the Recent tab. You will have following information in the Recent Runs page:
- Created date: You can see when this run has been created. You can sort the list based on the created date.
- Created By: You can see who has created this run.
- Status: View the status of run such as: Pending, Running, Completed, or Failed. You can sort and search the list based on status.
- Download: Click on either PDF or XLSX to download the reports.
- Refresh: Click the Refresh button to refresh the page.
- Search: Use the search field to filter runs based on their status.
Uninstallation of Reporting Apps
If you do not want to use the Reporting app, you can uninstall it from your system by following the steps below:
- Go to Reports > Reporting Apps Overview.
- Click the Installed tab to see all the installed apps.
- Click the three-dot symbol that appears below the apps, and then click the Remove button.
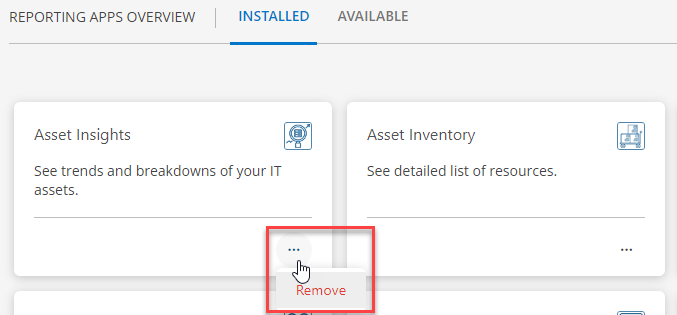
- Now a dialogue box will appear, enter the reason for the uninstallation and then click Uninstall.
Once you uninstalled the app, its associated analyses and runs can not be reversible.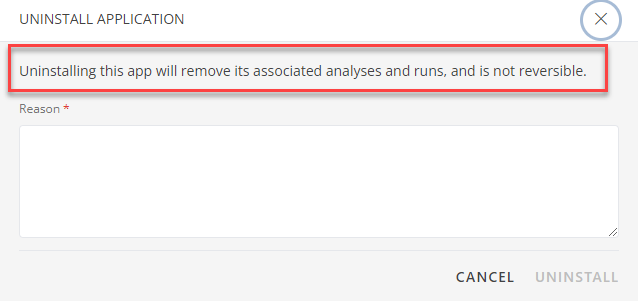
- You have now successfully uninstalled the Reporting app.