| Supported Versions |
|---|
| Target device version 12.3.X |
| REST API version using 12.3.X |
Introduction
NetApp SolidFire overview
SolidFire storage is an interconnection of hardware and software designed for complete automation and management of an entire SolidFire storage system.
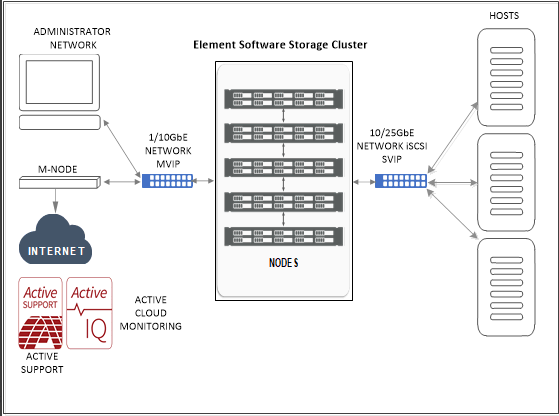
NetApp SolidFire Architecture:
The following diagram shows the basic layout of the SolidFire Storage System and how it connects to a network:
Cluster, Nodes, and Drives
Cluster
A cluster is the hub of a SolidFire Storage System and is made up of a collection of nodes. You must have at least four nodes in a cluster (five or more nodes are recommended) in order for SolidFire storage efficiencies to be realized. A cluster appears on the network as a single logical group and can then be accessed as block storage.
Creating a new cluster initializes a node as communications owner for a cluster and establishes network communications for each node in the cluster. This process is performed only once for each new cluster.
One can increase the scalability of the cluster by additional nodes upto 100. Adding additional nodes doesn’t cause any interruption of the service and the cluster automatically uses the performance and capacity of the new node.
The following diagram illustrates the basic Ip Address layout for the cluster.
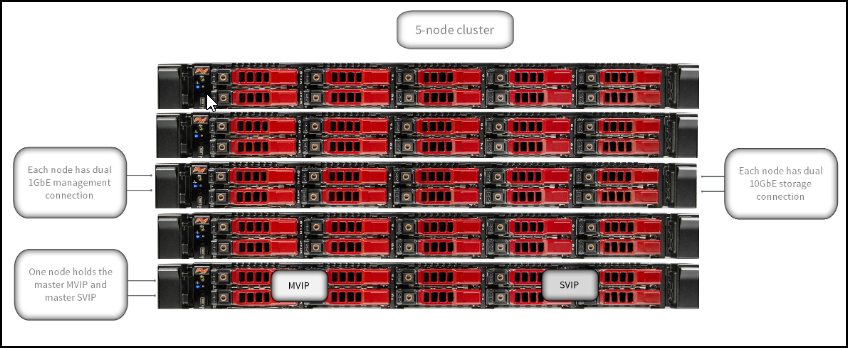
Administrators and hosts can access the cluster using virtual IP addresses. Any node in the cluster can host the virtual IP addresses. The Management Virtual IP (MVIP) enables cluster management through a 1GbE connection, while the Storage Virtual IP (SVIP) enables host access to storage through a 10GbE connection.
These virtual IP addresses enable consistent connections regardless of the size or makeup of a SolidFire cluster. If a node hosting a virtual IP address fails, another node in the cluster begins hosting the virtual IP address.
Nodes
Nodes are individual hardware components that are grouped into a cluster to be accessed as block-storage. There are two types of nodes in the SolidFire Storage system. They are Storage Nodes and Fibre-Channel Nodes.
Storage Nodes
A SolidFire storage node is a server containing a collection of drives that communicate with each other through the Bond10G network interface. Drives in the node contain block and metadata space for data storage and data management.
Storage nodes have the following characteristics:
- Each node has a unique name. If a node name is not specified by an administrator, it defaults to SF-XXXX, where XXXX is four random characters generated by the system.
- Each node has its own high-performance non-volatile random access memory (NVRAM) write cache to improve overall system performance and reduce write latency.
- Each node is connected to two networks, storage and management, each with two independent links for redundancy and performance. Each node requires an IP address on each network.
- You can create a cluster with new storage nodes, or add storage nodes to an existing cluster to increase storage capacity and performance.
- You can add or remove nodes from the cluster at any time without interrupting service.
Fibre Channel(FC) Nodes
SolidFire Fibre Channel nodes provide connectivity to a Fibre Channel switch, which you can connect to Fibre Channel clients. Fibre Channel nodes act as a protocol converter between the Fibre Channel and iSCSI protocols; this enables you to add Fibre Channel connectivity to any new or existing SolidFire cluster.
Fibre Channel nodes have the following characteristics:
- Fibre Channel switches manage the state of the fabric, providing optimized interconnections.
- The traffic between two ports flows through the switches only; it is not transmitted to any other port.
- Failure of a port is isolated and does not affect operation of other ports.
- Multiple pairs of ports can communicate simultaneously in a fabric.
Drives
A storage node contains one or more physical drives that are used to store a portion of the data for the cluster. The cluster utilizes the capacity and performance of the drive after the drive has been successfully added to a cluster.
A storage node contains two types of drives:
Volume metadata drives- volume metadata drives store the compressed information that defines each volume, clone, or snapshot within a cluster. The total metadata drive capacity in the system determines the maximum amount of storage that can be provisioned as volumes. The maximum amount of storage that can be provisioned is independent from how much data is actually stored on the block drives of the cluster. Volume metadata drives store data redundantly across a cluster using Double Helix data protection.
Note: Some system event log and error messages refer to volume metadata drives as slice drives.
Block drives- block drives store the compressed, de-duplicated data blocks for server application volumes. Block drives make up a majority of the storage capacity of the system. The majority of read requests for data already stored on the SolidFire cluster, as well as requests to write data, occur on the block drives. The total block drive capacity in the system determines the maximum amount of data that can be stored, taking into account the effects of compression, thin provisioning, and de-duplication.
SolidFire Element OS Features
The SolidFire Element Operating System (OS) comes preinstalled on each node. SolidFire Element OS includes the following features:
- SolidFire Helix™ self-healing data protection
- Always on, inline, real-time deduplication
- Always on, inline, real-time compression
- Always on, inline, reservation-less thin provisioning
- Fibre Channel node integration
- Management Node
- LDAP capability for secure login functionality
- Guaranteed volume level Quality of Service (QoS): Minimum IOPS, Maximum IOPS, IOPS burst control
- nstant, reservation-less deduplicated cloning
- Volume snapshots: i) Snapshots of individual volumes, ii) Scheduling snapshots of a volume or group of volumes, iii) Consistent snapshots of a group of volumes, iv) Cloning multiple volumes individually or from a group snapshot
- Integrated Backup and Restore for volumes
- Real-Time Replication for clusters and volumes
- Native multi-tenant (VLAN) management and reporting: i) Virtual Routing and Forwarding (VRF), ii) Tagged Networks
- Proactive Remote Monitoring through Active IQ
- Complete REST-based API management
- Granular management access/role-based access control
- Virtual Volumes (VVols) support for VMware® vSphere®
- Volume and system level performance and data usage reporting
- VASA support
- VMware vSphere® (VAAI) support
Use Cases
Discovery Use Cases:
- Provides resource visibility to the administrator to view and manage resources available (Ex: Cluster, Nodes, Drives, Volume Accounts and Volumes) under different resource types
- Publishes relationships between resources to have a topological view and ease of maintenance
Monitoring Use Cases:
- Provides metrics related to Memory Utilization, Performance Utilization and so on for different resources
- Concern alerts will be generated for each metric to notify the administrator regarding the issue with the resource
Resource Hierarchy:
Cluster
— Nodes
— Drive
— Volumes Accounts
— Volumes
Prerequisites
The OpsRamp Gateway must be installed.
Configure and install the integration
- Go to Setup > Integrations and Apps.
- Click + ADD on the INSTALLED APP page. The ADD APP page displays all the available applications along with the newly created application with the version.
Notes:- If there are already installed applications, it will redirect to the INSTALLED APPS page, where all the installed applications are displayed.
- If there are no installed applications, it will navigate to the ADD APP page.
- You can even search for the application using the search option available. Also you can use the All Categories option to search.
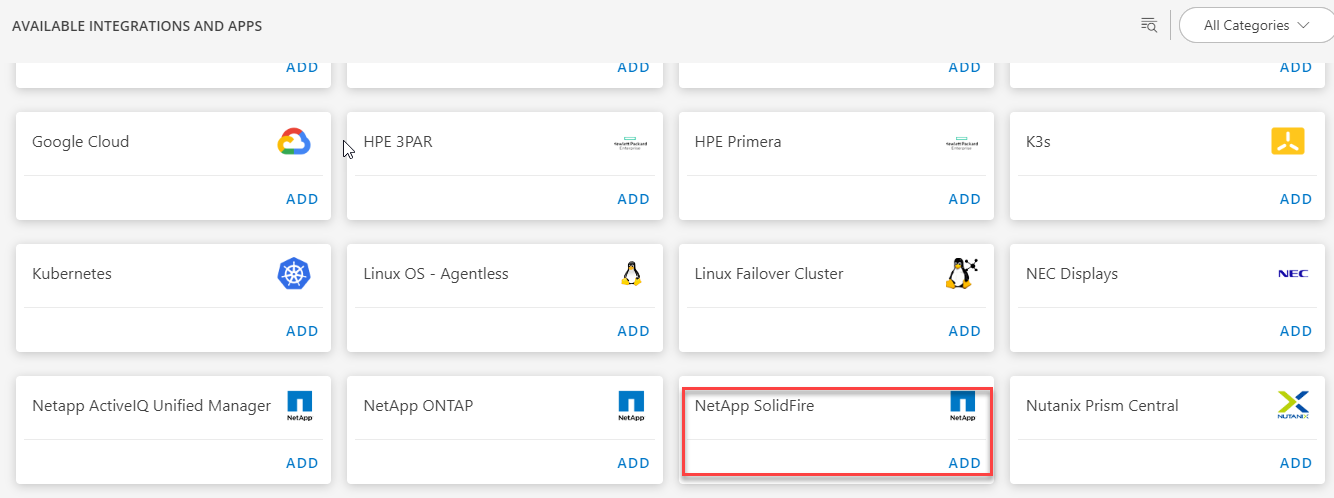
- Click ADD in the netapp-solidfire application.
- In the Configurations page, click + ADD. The Add Configuration page appears.
- Enter the below mentioned BASIC INFORMATION:
| Object Name | Description |
|---|---|
| Name | Enter the name for the integration |
| IP Address/Host Name | IP address/host name of the target. |
| Port | Port Note: Default port is 443 |
| Credentials | Select the credentials from the drop-down list. Note: Click + Add to create a credential. |
Notes:
- By default the Is Secure checkbox is selected.
- Select the following:
- App Failure Notification: if turned on, you will be notified in case of an application failure.
- Event Polling: enables integrating third party alerts into OpsRamp using further configurations.
- Alert On Root Resource: alerts generated by on root resource
- Below are the default values set for:
- Alert Severity: Possible values of Alert Severity Filter configuration property are warning, critical, error.
- Alert Severity Mapping: Possible values of Alert Severity Mapping Filter configuration property are “critical":“Critical”, “error”:“Critical”, “warning”:“Warning”.
In the RESOURCE TYPE section, select:
- ALL: All the existing and future resources will be discovered.
- SELECT: You can select one or multiple resources to be discovered.
In the DISCOVERY SCHEDULE section, select Recurrence Pattern to add one of the following patterns:
- Minutes
- Hourly
- Daily
- Weekly
- Monthly
Click ADD.
Now the configuration is saved and displayed on the configurations page after you save it.
Note: From the same page, you may Edit and Remove the created configuration.Click NEXT
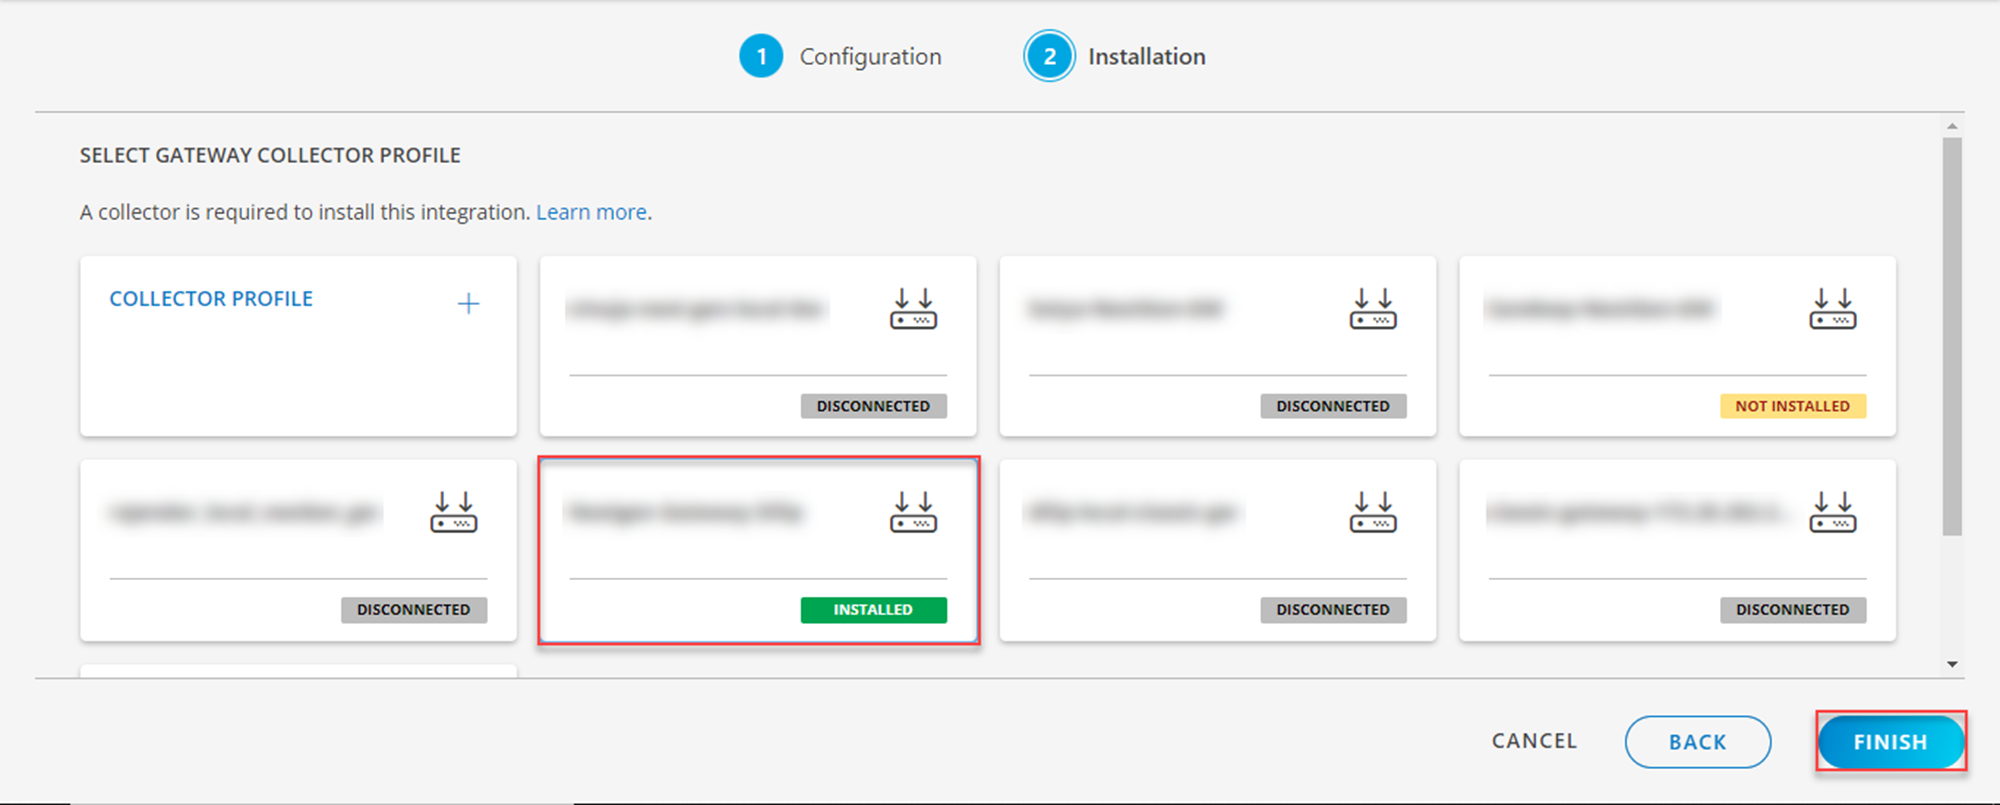
In the Installation page, select an existing registered gateway profile, and click FINISH.
The application is now installed and displayed on the Installed Integration page. Use the search field to find the installed application.
Modify the Configuration
See Modify an Installed Integration or Application article.
Note: Select the NetApp SolidFire application.
View the NetApp SolidFire details
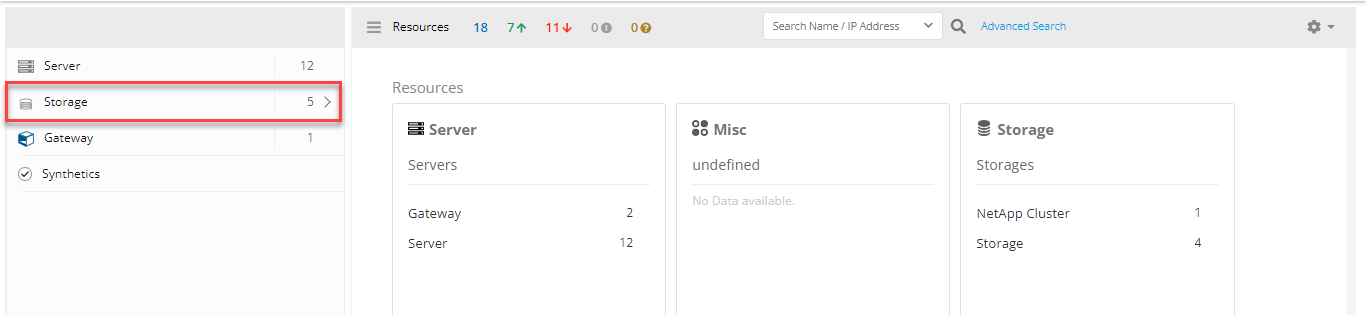
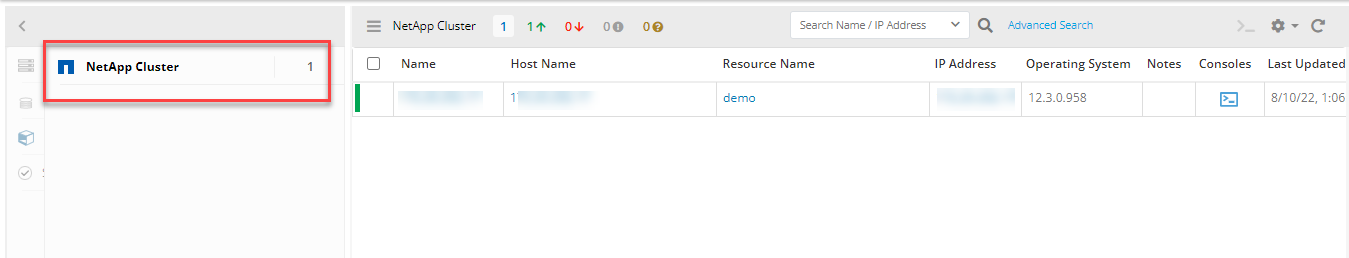
To view the resource information, go to Infrastructure > Resources > Storage >NetApp Cluster and click on your created cluster name.
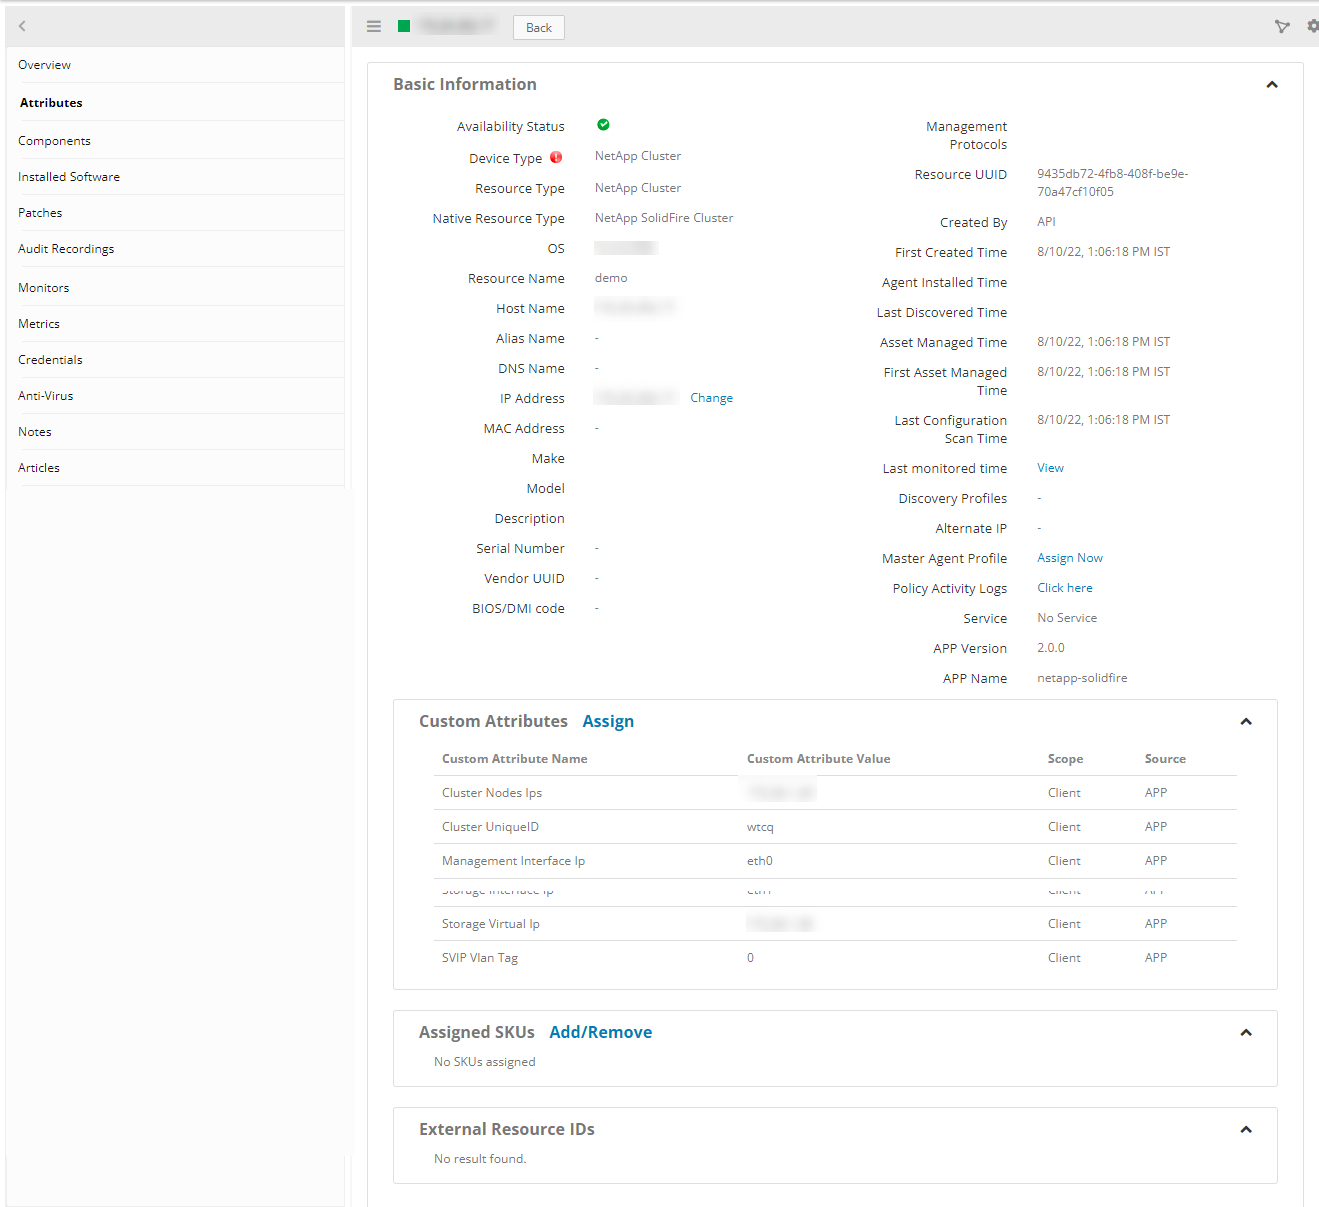
View resource attributes
The discovered resource(s) are displayed under Attributes. In this page you will get the basic information about the resources such as: Resource Type, Native Resource Type, Resource Name, IP Address, and so on.
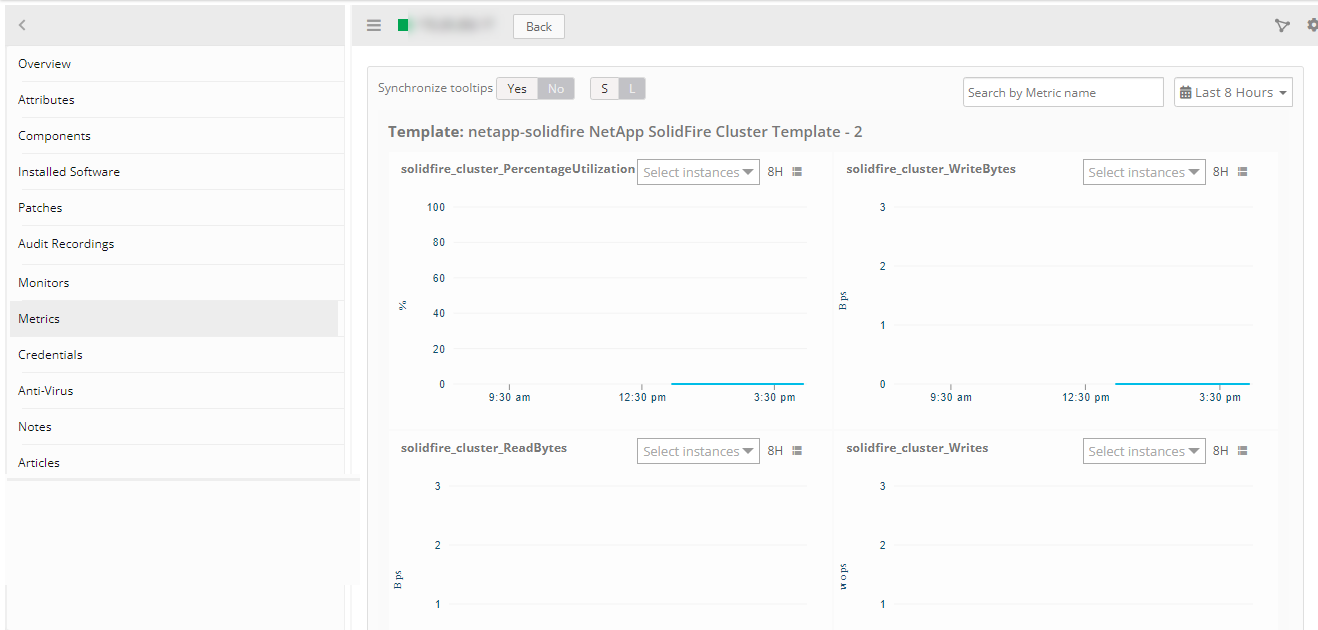
View resource metrics
To confirm NetApp SolidFire monitoring, review the following:
- Metric graphs: A graph is plotted for each metric that is enabled in the configuration.
- Alerts: Alerts are generated for metrics that are configured as defined for integration.
Supported Metrics
| Component | Metric Name | Metric Display Name | Units |
|---|---|---|---|
| Cluster | solidfire_cluster_Reads | SolidFire Cluster ReadOps | rops |
| solidfire_cluster_Writes | SolidFire Cluster WriteOps | wops | |
| solidfire_cluster_ReadBytes | SolidFire Cluster ReadBytes | Bps | |
| solidfire_cluster_WriteBytes | SolidFire Cluster WriteBytes | Bps | |
| solidfire_cluster_PercentageUtilization | SolidFire Cluster Utilization Percentage | percent | |
| solidfire_cluster_TotalCapacity | SolidFire Cluster Total Capacity | GB | |
| solidfire_cluster_UsedCapacity | SolidFire Cluster Used Capacity | GB | |
| solidfire_cluster_ClusterPairStatus | SolidFire Paired Cluster Status | ||
| Nodes | solidfire_node_ClusterBytesIn | Node Cluster Bytes In | Bps |
| solidfire_node_ClusterBytesOut | Node Cluster Bytes Out | Bps | |
| solidfire_node_ClusterNetworkUtilization | Cluster Network Utilization | percent | |
| solidfire_node_StorageNetworkUtilization | Storage Network Utilization | percent | |
| solidfire_node_StorageBytesIn | Node Storage Bytes In | Bps | |
| solidfire_node_StorageBytesOut | Node Storage Bytes Out | Bps | |
| solidfire_node_MgmtBytesIn | Node Management Bytes In | Bps | |
| solidfire_node_MgmtBytesOut | Node Management Bytes Out | Bps | |
| solidfire_node_CpuUtilization | Node CPU Utilization | percent | |
| solidfire_node_UsedMemory | Node Memory Used | GB | |
| Volumes | solidfire_volume_account_Status | SolidFire Volume Account Status | |
| solidfire_volume_Reads | SolidFire Volume Reads | rops | |
| solidfire_volume_Writes | SolidFire Volume Writes | wops | |
| solidfire_volume_ReadBytes | SolidFire Volume Read Bytes | Bps | |
| solidfire_volume_WriteBytes | SolidFire Volume Write Bytes | Bps | |
| solidfire_volume_ReadLatency | SolidFire Volume Read Latency | microsec | |
| solidfire_volume_WriteLatency | SolidFire Volume Write Latency | microsec | |
| solidfire_volume_PercentageUtilization | SolidFire Volume Utilization Percentage | percent | |
| solidfire_volume_UnalignedWrites | SolidFire Volume Unaligned Writes | wps | |
| solidfire_volume_UnalignedReads | SolidFire Volume Unaligned Reads | rps | |
| solidfire_volume_snapshot_TotalSize | SolidFire Volume Snapshot TotalSize | GB | |
| solidfire_volume_snapshot_Status | SolidFire Volume Snapshot Status | ||
| solidfire_volume_ReplicationStatus | SolidFire Remote Volume Replication Status | ||
| solidfire_volume_TotalCapacity | SolidFire Volume Total Capacity | GB | |
| solidfire_volume_Status | SolidFire Volume Status | ||
| Storage Drives | solidfire_drive_TotalCapacity | SolidFire Drive Total Capacity | GB |
| solidfire_drive_UsedCapacity | SolidFire Drive Used Capacity | GB | |
| solidfire_drive_UsedMemory | SolidFire Drive Used Memory | GB | |
| solidfire_drive_Status | Solidfire Drive Status | ||
Default monitoring configurations
NetApp SolidFire application has default Global Device Management Policies, Global Templates, Global Monitors and Global metrics in OpsRamp. You can customize these default monitoring configurations as per your business use cases by cloning respective global templates and global Device Management Policies. OpsRamp recommends performing the below activity before installing the app to avoid noise alerts and data.
Default Global Device Management Policies
OpsRamp has a Global Device Management Policy for each Native Type of NetApp SolidFire. You can find those Device Management Policies at Setup -> Resources -> Device Management Policies, Search with suggested names in global scope. Each Device Management Policy follows below naming convention:
{appName nativeType - version}Ex: netapp-solidfire NetApp SolidFire Cluster - 1 (i.e, appName = netapp-solidfire, nativeType = NetApp SolidFire Cluster, version = 1)
Default Global Templates
OpsRamp has a Global Template for each Native Type of NetApp SolidFire. We can find those templates at Setup -> Monitoring -> Templates -> Search with suggested names in global scope. Each template follows below naming convention:
{appName nativeType 'Template' - version}Ex: netapp-solidfire NetApp SolidFire Cluster Template - 1 (i.e, appName = netapp-solidfire, nativeType = NetApp SolidFire Cluster, version = 1)
Default Global Monitors
OpsRamp has a Global Monitors for each Native Type which has monitoring support. We can find those monitors at Setup -> Monitoring -> Monitors, Search with suggested names in global scope. Each Monitors follows below naming convention:
{monitorKey appName nativeType - version}Ex: SolidFire Cluster Monitor netapp-solidfire NetApp SolidFire Cluster 1 (i.e, monitorKey = SolidFire Cluster Monitor, appName = netapp-solidfire, nativeType = NetApp SolidFire Cluster, version = 1)
Risks, Limitations & Assumptions
- Application can handle Critical/Recovery failure notifications for below two cases when user enables App Failure Notifications in configuration
- Connectivity Exception
- Authentication Exception
- Application will not send any duplicate/repeat failure alert notification until the already existing critical alert is recovered.
- Using metrics for monitoring the resources and generating alerts when the threshold values are breached.
- Application cannnot control monitoring pause/resume actions based on above alerts.
- SolidFire Event/Alert Polling will be started only if the user enables Event Polling in configuration.
- Possible values of Alert Severity Filter configuration property are warning, critical and error.
- OpsRamp has given sample mappings to map SolidFire Severity with OpsRamp Severities as part of the Event/Alert Severity Mapping configuration file. Users can modify them as per their use-case at any point of time from the SDK application configuration page. Possible OpsRamp Severities are Critical, Warning, Ok, Info.
- In NetApp Solidfire is not getting the resource name for drive resources. So have given the drive resource name as a combination of driveId, nodeId and chassis-slotExample : 1.1.1(driveId.nodeId.chassis-slot).
- No support of showing activity log and applied time.
- No support for the option to get Latest snapshot metric.