| Supported Versions |
|---|
| Target device version 9.8 |
| REST API version using 9.8 |
Introduction
ONTAP has evolved from NetApp’s original operating system. It is most popular and widely-deployed operating system.
The different platforms that it can run on now are FAS, AFF, ONTAP Select, Cloud Volumes ONTAP, and NetApp Private Storage.
The different platforms run on hardware or virtual machine, and on premises or in the cloud.
NetApp ONTAP Architecture:
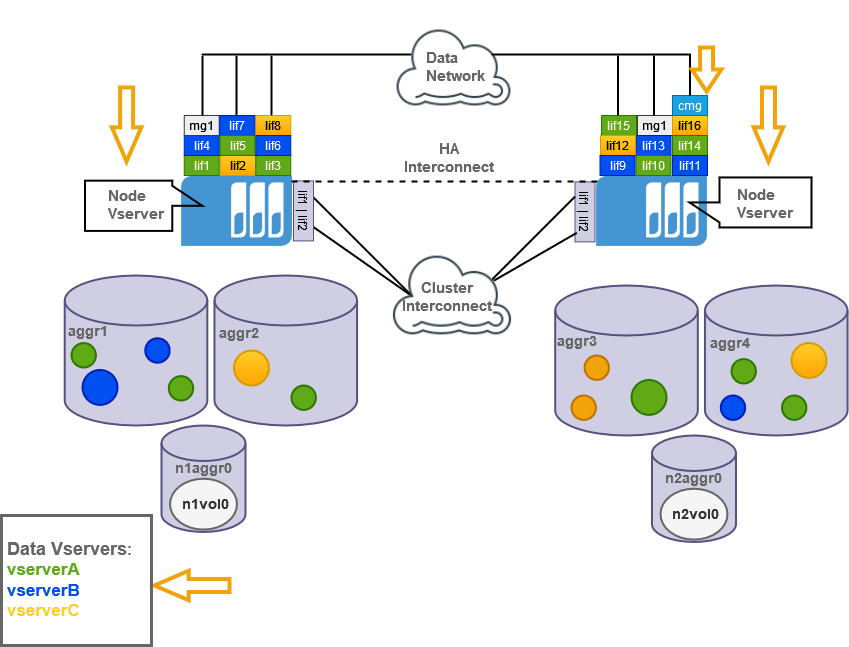
Cluster, Cluster Nodes and Disks
An ONTAP cluster can be as small as a single node cluster. Running a single node cluster means actually losing the access to data if the node fails. Simply it is not redundant.
To be redundant we can add another node to the existing cluster to form a HA-Pair. The two nodes which are connected in HA-Pair share a single disk. If we run a HA-Pair then we will have HA-Interconnect. This HA-Interconnect mirrors the NVRAM between these two nodes. So if one of the node fails then the other node can take over the aggregates of the failed node. Thus, there will be no loss of data even if one of the node fails. We have a network called Cluster Interconnect. The Cluster Interconnect is used for heartbeat configuration management and volume data between the cluster nodes.
A cluster node can be scaled out by connecting one or more HA-Pairs to the same cluster. Each HA-pair should be connected to Cluster Interconnect and each HA-pair contains individual HA_Interconnect.
Based on the protocols we use the maximum number of HA-Pairs and can be configured as follows:
- NAS : 12 HA-Pairs (24 Nodes)
- SAN : 6 HA-Pairs (12 Nodes)
Aggregates, Volumes and SVMs
Client data and configuration data in ONTAP is stored in volumes, and volumes are always a part of an aggregate. Aggregate is a collection of disks. Each node contains only one root aggregate, but we can have multiple data aggregates per node. In the case of node failure the surviving node will take over the aggregates of the failed node by default. In case of single HA-Pair the aggregates will be given back automatically after the failed node is up and running again.
There is a very important volume called root volume typically named as vol0, which is located in root aggregate. This volume is a node volume which contains cluster configurations and log files. So every node contains a volume named vol0.
A cluster always runs virtual machines. SVMs are logical representation of one of four types. They are:
System Type (Cluster SVM) : We have only one such type of SVM in the cluster. This SVM is used to manage the cluster Inter-Connect interfaces.
Node Type (Node SVM) : Each node in the cluster is represented as a node SVM.
Admin Type (Cluster Management SVM) : Usually connect to this type of SVM when we want to manage the cluster. Basically it represents the cluster.
Data Type : Depending on the number of nodes and protocols we use we can have upto a maximum of 1000 SVMs of this type. These type of SVMs are used to represent data towards our NAS and SAN clients. The data of the SVMs is stored in volumes. All the volumes belonging to a particular data SVM are a part of namespace of that particular SVM. Therefore, the namespace of a data SVM contains all of its data volumes. A data SVM contains exactly one root volume. This is a very small volume of 1GB commonly used to manage data volumes. This root volume should never contain data and the only information available from the root volume is junction paths of the connected data volumes. In a NAS environment the volumes have to be managed, otherwise they are not accessible by the clients.
LUNs and QTrees
A LUN is the logical representation of storage in a storage area network (SAN). In ONTAP, a LUN is located within a volume. Optionally, it can be located within a Qtree in a volume.
A Qtree is a logically defined file system that can exist as a special subdirectory of the root directory within a FlexVol volume or a FlexGroup volume.
Resource Hierarchy:
NetApp Cluster
— Cluster Nodes
— Aggregates
— Storage Ports
— Ethernet Ports
— Logical Interfaces(LIF’s)
— FCP Adapters
— FC Interfaces
— Storage Virtual Machine/SVM
— Storage Volumes
— Storage Luns
— QTrees
— Disks
— Shelves
Metro Cluster
— Metro Cluster Nodes
Prerequisites
The OpsRamp Gateway must be installed.
To check the TLS status:
SSH username@hostname
system services web show
If TLS is not enabled: tls.enable on
Example output:
External Web Services: true
               Status: online
   HTTP Protocol Port: 80
  HTTPS Protocol Port: 443
        TLSv1 Enabled: true
        SSLv3 Enabled: true
        SSLv2 Enabled: true
Configure and install the integration
- Go to Setup > Integrations and Apps.
- Click + ADD on the INSTALLED APP page. The ADD APP page displays all the available applications along with the newly created application with the version.
Notes:- If there are already installed applications, it will redirect to the INSTALLED APPS page, where all the installed applications are displayed.
- If there are no installed applications, it will navigate to the ADD APP page.
- You can even search for the application using the search option available. Also you can use the All Categories option to search.
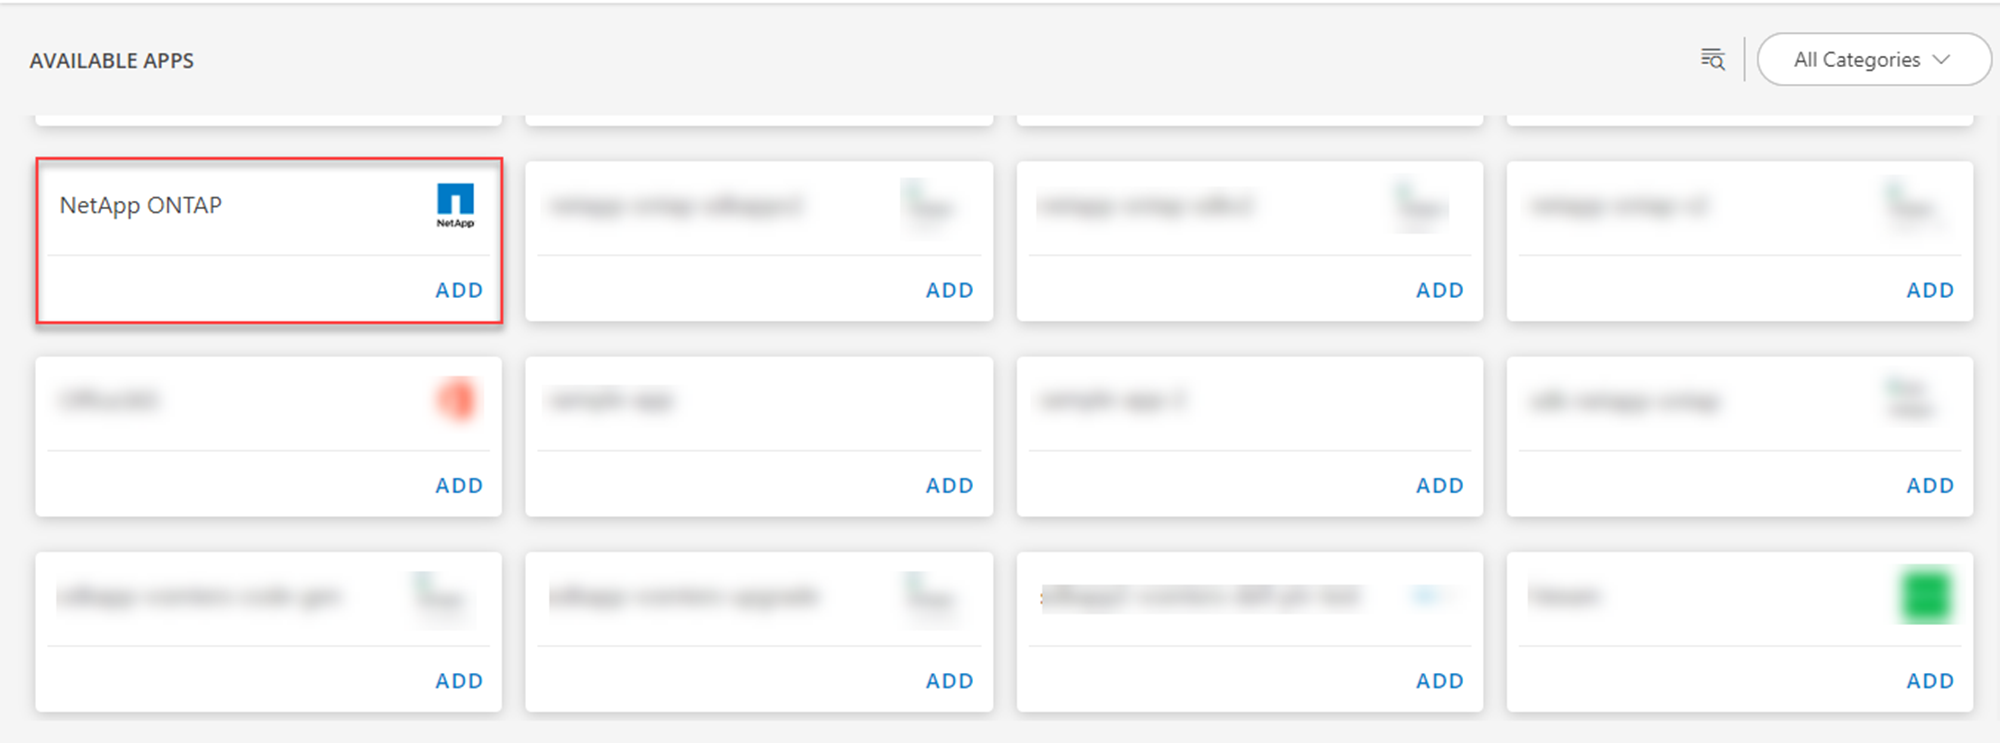
- Click ADD in the NetApp ONTAP application.
- In the Configurations page, click + ADD. The Add Configuration page appears.
- Enter the below mentioned BASIC INFORMATION
| Object Name | Description |
|---|---|
| Name | Enter the name for the integration |
| IP Address/Host Name | IP address/host name of the target. |
| Port | Port. Example: You can enter 8080 as a port value. |
| Credentials | Select the credentials from the drop-down list. Note: Click + Add to create a credential. |
Notes:
- By default the Is Secure checkbox is selected.
- App Failure Notifications: if turned on, you will be notified in case of an application failure that is, Connectivity Exception, Authentication Exception.
In the RESOURCE TYPE section, select:
- ALL: All the existing and future resources will be discovered.
- SELECT: You can select one or multiple resources to be discovered.
In the DISCOVERY SCHEDULE section, select Recurrence Pattern to add one of the following patterns:
- Minutes
- Hourly
- Daily
- Weekly
- Monthly
Click ADD.
Now the configuration is saved and displayed on the configurations page after you save it.
Note: From the same page, you may Edit and Remove the created configuration.Click NEXT
In the Installation page, select an existing registered gateway profile, and click FINISH.
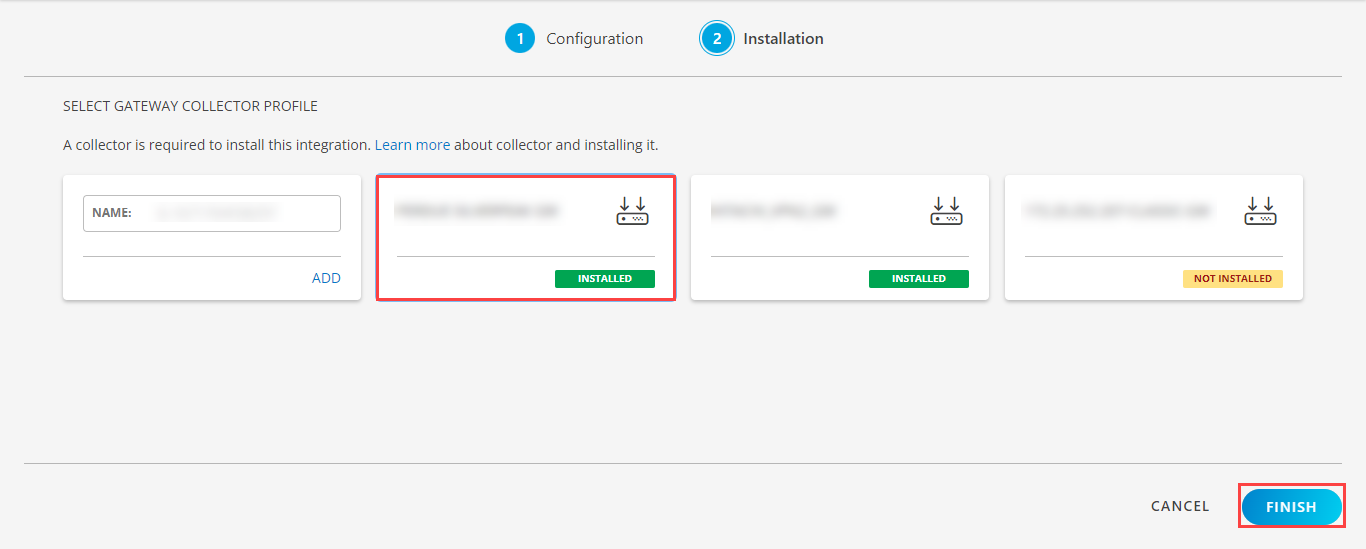
The application is now installed and displayed on the Installed Integration page. Use the search field to find the installed application.
Modify the Configuration
See Modify an Installed Integration or Application article.
Note: Select the NetAPP ONTAP application.
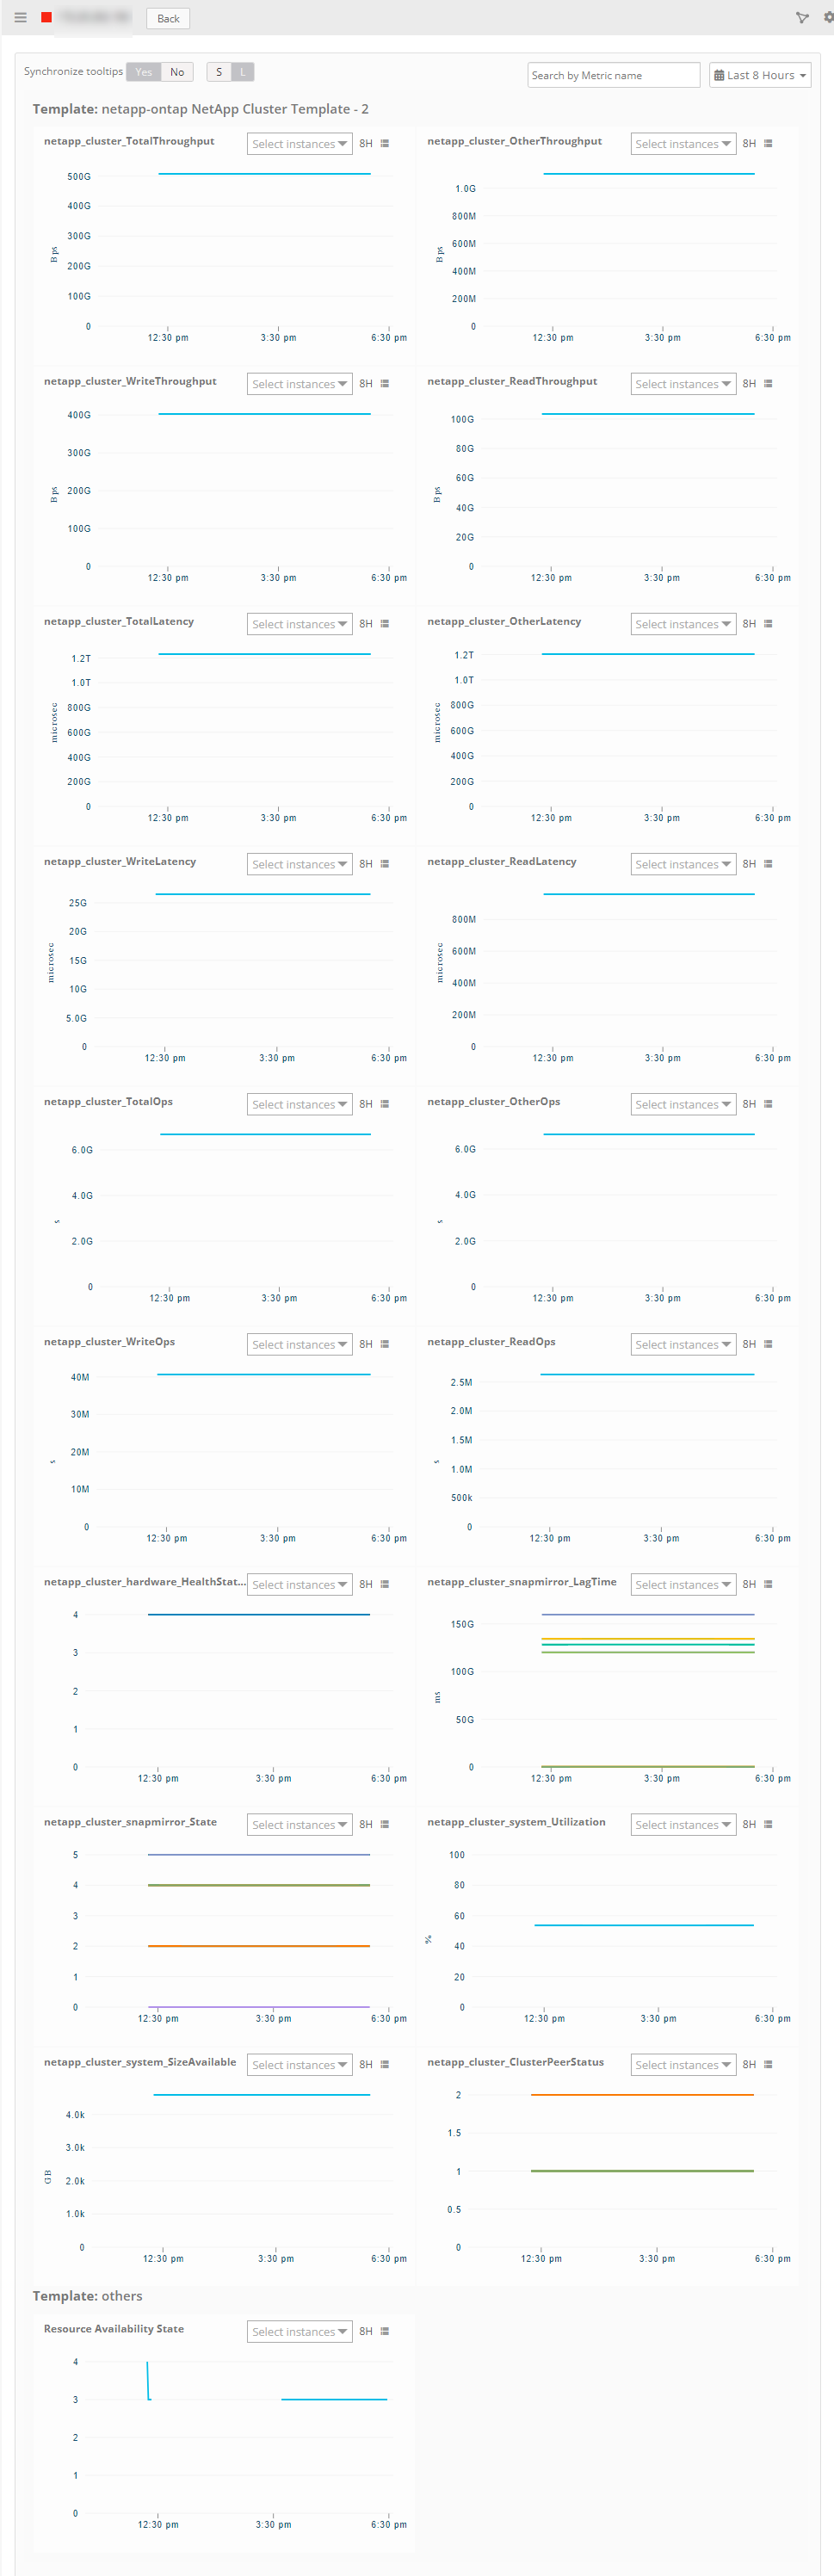
View the NetApp ONTAP details
The discovered resource(s) are displayed in Infrastructure > Resources > Storage > NetApp Cluster, with Native Resource Type as NetApp Cluster. You can navigate to the Attributes tab to view the discovery details, and Metrics tab to view the metric details for NetApp ONTAP.
View resource metrics
To confirm NetApp-ONTAP monitoring, review the following:
- Metric graphs: A graph is plotted for each metric that is enabled in the configuration.
- Alerts: Alerts are generated for metrics that are configured as defined for integration.
Supported Metrics
| Metric Name | Metric Display Name | Units | Units |
|---|---|---|---|
| netapp_cluster_ReadOps | NetApp Cluster Read Ops | s | Number of read I/O operations performed on the cluster |
| netapp_cluster_WriteOps | NetApp Cluster Write Ops | s | Number of write I/O operations performed on a cluster |
| netapp_cluster_OtherOps | NetApp Cluster Other Ops | s | Number of other operations performed on cluster. Other I/O operations can be metadata operations, such as directory lookups and so on |
| netapp_cluster_TotalOps | NetApp Cluster Total Ops | s | Performance metric aggregated over all types of I/O operations |
| netapp_cluster_ReadLatency | NetApp Cluster Read Latency | microsec | Latency for all read operations in the system in microseconds |
| netapp_cluster_WriteLatency | NetApp Cluster Write Latency | microsec | Latency for all write operations in the system in microseconds |
| netapp_cluster_OtherLatency | NetApp Cluster Other Latency | microsec | Latency for all other operations in the system in microseconds |
| netapp_cluster_TotalLatency | NetApp Cluster Total Latency | microsec | Latency for all total operations in the system in microseconds |
| netapp_cluster_ReadThroughput | NetApp Cluster Read ThroughPut | Bps | Read Throughput for all read I/O operations |
| netapp_cluster_WriteThroughput | NetApp Cluster Write ThroughPut | Bps | WriteThroughput for all write I/O operations |
| netapp_cluster_OtherThroughput | NetApp Cluster Other ThroughPut | Bps | Other Throughput for all other I/O operations. Other I/O operations can be metadata operations, such as directory lookups |
| netapp_cluster_ClusterPeerStatus | NetApp Cluster Peer Cluster Status | Returns the state of the peer cluster. Possible states are available, partial, unavailable, pending, unidentified | |
| netapp_cluster_system_SizeAvailable | Netapp Cluster System Size Available | GB | System Available size.Sum of the available size of all the aggregates in a cluster |
| netapp_cluster_system_Utilization | Netapp Cluster System Utilization | % | System Utilization |
| netapp_cluster_metrocluster_ConfigurationState | NetApp Cluster MetroCluster Configuration State | Indicates the state of the local cluster configuration.Possible states are configuration_error, configured, not_configured, not_reachable, partially_configured, unknown | |
| netapp_cluster_metrocluster_IsPartnerClusterReachable | NetApp Cluster MetroCluster Partner Cluster Reachability | Specifies whether the partner cluster is reachable from the local cluster. | |
| netapp_cluster_snapmirror_State | NetApp Cluster SnapMirror State | SnapMirror state.Possible states are broken_off, paused, snapmirrored, uninitialized, in_sync, out_of_sync, synchronizing | |
| netapp_cluster_snapmirror_LagTime | NetApp Cluster SnapMirror LagTime | ms | Time since the exported Snapshot copy was created |
| netapp_cluster_hardware_HealthStatus | NetApp Cluster Hardware Health Status | Returns the status of the Hardware Components of the Cluster. Possible states are unknown(0), unreachable(1), degraded(2), ok-with-suppressed(3) and ok(4) | |
| netapp_node_UpTime | NetApp Cluster Node UpTime | s | Total time in seconds that the node has been up |
| netapp_node_ControllerOverTemperature | NetApp Cluster Node Controller Over Temperature | Node Controller Over Temperature. Possible values are over, normal | |
| netapp_node_State | NetApp Cluster Node State | State of the Node. Possible states are up, booting, down, taken_over, waiting_for_giveback, degraded, unknown | |
| netapp_node_FrusState | NetApp Cluster Node Frus State | State of List of FRUs on the node.Possible values are ok(1), error(0) | |
| netapp_node_ServiceProcessorState | NetApp Cluster Node ServiceProcessor State | State of the service processor on the node.Possible states are online, offline, degraded, rebooting, unknown, updating, node_offline, sp_daemon_offline | |
| netapp_node_ServiceProcessorLinkStatus | NetApp Cluster Node ServiceProcessor Link Status | Service Processor Link status on the Node.Possible states are up, down, disabled, unknown | |
| netapp_node_CpuUtilization | NetApp Cluster Node Cpu Utilization | % | Node CPU Utilization |
| netapp_node_HaPortState | NetApp Cluster Node HA Port State | Node HA Port State.Possible states are down, initialized, armed, active, reserved | |
| netapp_node_TakeOverState | NetApp Cluster Node TakeOver State | Represents the state of the node that is taking over storage from its HA partner | |
| netapp_node_GiveBackState | NetApp Cluster Node GiveBack State | Represents the state of the node that is giving storage back to its HA partner | |
| netapp_aggregate_State | NetApp Cluster Aggregate State | operational State of the Aggregate. Possible states are online, onlining, offline, offlining, relocating, unmounted, restricted, inconsistent, failed, unknown | |
| netapp_aggregate_SizeUsed | NetApp Cluster Aggregate Size Used | GB | Space used or reserved. Includes volume guarantees and aggregate metadata |
| netapp_aggregate_SizeTotal | NetApp Cluster Aggregate Size Total | GB | Total usable space not including WAFL reserve and aggregate Snapshot copy reserve |
| netapp_aggregate_SizeAvailable | NetApp Cluster Aggregate Size Available | GB | Space available on the Aggregate |
| netapp_aggregate_PercentUsedCapacity | NetApp Cluster Aggregate Percentage Used Capacity | % | Percentage used Capacity of an Aggregate |
| netapp_aggregate_SpaceFullThresholdPercent | NetApp Cluster Aggregate SpaceFull Threshold percent | % | Spacefull Threshold Percentage of an Aggregate |
| netapp_aggregate_InactiveUserData | NetApp Cluster Aggregate Inactive User Data | GB | The size that is physically used in the block storage and has a cold temperature.only supported if the aggregate is either attached to a cloud store or can be attached to a cloud store. |
| netapp_aggregate_MirrorState | NetApp Cluster Aggregate Mirror state | Aggregate Mirror State. Possible states are unmirrored, normal, degraded, resynchronizing, failed | |
| netapp_aggregate_DiskCount | NetApp Cluster Aggregate Disk Count | count | Number of disks used in the aggregate. This includes parity disks, but excludes disks in the hybrid cache |
| netapp_aggregate_RaidSize | NetApp Cluster Aggregate Raid Size | count | Specifies the maximum number of disks that can be included in a RAID group. |
| netapp_aggregate_ReadThroughput | NetApp Cluster Aggregate Read ThroughPut | Bps | Read Throughput for all read I/O operations |
| netapp_aggregate_WriteThroughput | NetApp Cluster Aggregate Write ThroughPut | Bps | WriteThroughput for all write I/O operations |
| netapp_aggregate_TotalThroughput | NetApp Cluster Aggregate Other ThroughPut | Bps | Other Throughput for all other I/O operations. Other I/O operations can be metadata operations, such as directory lookups |
| netapp_aggregate_OtherThroughput | NetApp Cluster Aggregate Total ThroughPut | Bps | Total Throughput for all types of I/O operations |
| netapp_aggregate_ReadOps | NetApp Cluster Aggregate Read Ops | s | Number of read I/O operations performed on an aggregate |
| netapp_aggregate_WriteOps | NetApp Cluster Aggregate Write Ops | s | Number of write I/O operations performed on an aggregate |
| netapp_aggregate_TotalOps | NetApp Cluster Aggregate Other Ops | s | Number of other operations performed on an aggregate. Other I/O operations can be metadata operations, such as directory lookups and so on |
| netapp_aggregate_OtherOps | NetApp Cluster Aggregate Total Ops | s | Performance metric aggregated over all types of I/O operations of an aggregate |
| netapp_aggregate_ReadLatency | NetApp Cluster Aggregate Read Latency | microsec | Latency for all read operations of an aggregate in microseconds |
| netapp_aggregate_WriteLatency | NetApp Cluster Aggregate Write Latency | microsec | Latency for all write operations of an aggregate in microseconds |
| netapp_aggregate_TotalLatency | NetApp Cluster Aggregate Other Latency | microsec | Latency for all other operations of an aggregate in microseconds |
| netapp_aggregate_OtherLatency | NetApp Cluster Aggregate Total Latency | microsec | Latency for all total operations of an aggregate in microseconds |
| netapp_aggregate_AvgReadThroughput | NetApp Cluster Aggregate Average Read ThroughPut | Bps | Displays the incremental average read throughput over the last 1 hour with 15 seconds sampling |
| netapp_aggregate_AvgWriteThroughput | NetApp Cluster Aggregate Average Write ThroughPut | Bps | Displays the incremental average write throughput over the last 1 hour with 15 seconds sampling |
| netapp_aggregate_AverageThroughput | NetApp Cluster Aggregate Average ThroughPut | Bps | Displays the incremental average throughput over the last 1 hour with 15 seconds sampling |
| netapp_aggregate_AvgOtherThroughput | NetApp Cluster Aggregate Average Other ThroughPut | Bps | Displays the incremental average other throughput over the last 1 hour with 15 seconds sampling |
| netapp_aggregate_AvgReadLatency | NetApp Cluster Aggregate Average Read Latency | microsec | Displays the incremental average for read latency over the last 1 hour with 15 seconds sampling |
| netapp_aggregate_AvgWriteLatency | NetApp Cluster Aggregate Average Write Latency | microsec | Displays the incremental average for write latency over the last 1 hour with 15 seconds sampling |
| netapp_aggregate_AverageLatency | NetApp Cluster Aggregate Average Latency | microsec | Displays the incremental average for latency over the last 1 hour with 15 seconds sampling |
| netapp_aggregate_AvgOtherLatency | NetApp Cluster Aggregate Average Other Latency | microsec | Displays the incremental average for other latencyover the last 1 hour with 15 seconds sampling |
| netapp_aggregate_AvgReadOps | NetApp Cluster Aggregate Average Read Ops | s | Displays the incremental changes in read IOPs over the last 1 hour with 15 seconds sampling |
| netapp_aggregate_AvgWriteOps | NetApp Cluster Aggregate Average Write Ops | s | Displays the incremental changes in write IOPs over the last 1 hour with 15 seconds sampling |
| netapp_aggregate_AvgOps | NetApp Cluster Aggregate Average Ops | s | Displays the incremental changes in IOPs over the last 1 hour with 15 seconds sampling |
| netapp_aggregate_AvgOtherOps | NetApp Cluster Aggregate Average Other Ops | s | Displays the incremental changes in other IOPs over the last 1 hour with 15 seconds sampling |
| netapp_aggregate_SnapshotReservePercent | NetApp Cluster Aggregate Snapshot Reserve percentage | % | NetApp Cluster Aggregate Snapshot Reserve percentage |
| netapp_disk_State | NetApp Cluster Disk State | NetApp Cluster Disk State | |
| netapp_disk_SizeAvailable | NetApp Cluster Disk Size Available | GB | NetApp Cluster Disk Size Available |
| netapp_disk_RevolutionsPerMinute | NetApp Cluster Disk Revolutions Per Minute | rpm | NetApp Cluster Disk Revolutions Per Minute |
| netapp_fcp_State | NetApp Cluster FC Port State | FC Port State.Possible states are startup, link_not_connected, online, link_disconnected, offlined_by_user, offlined_by_system, node_offline, unknown | |
| netapp_fcp_ReadThroughPut | NetApp Cluster FC Port Read ThroughPut | Bps | Read Throughput for all read I/O operations of an FC Port |
| netapp_fcp_WriteThroughPut | NetApp Cluster FC Port Write ThroughPut | Bps | WriteThroughput for all write I/O operations of an FC Port |
| netapp_fcp_TotalThroughPut | NetApp Cluster FC Port Total ThroughPut | Bps | Total Throughput for all types of I/O operations of an FC Port |
| netapp_fcp_ReadLatency | NetApp Cluster FC Port Read Latency | microsec | Latency for all read operations in microseconds |
| netapp_fcp_WriteLatency | NetApp Cluster FC Port Write Latency | microsec | Latency for all write operations system in microseconds |
| netapp_fcp_TotalLatency | NetApp Cluster FC Port Total Latency | microsec | Latency for all total operations in microseconds |
| netapp_fcp_OtherLatency | NetApp Cluster FC Port Other Latency | microsec | Latency for all other operations in microseconds |
| netapp_fcp_ReadOps | NetApp Cluster FC Port Read Ops | s | Number of read I/O operations performed on the FC Port |
| netapp_fcp_WriteOps | NetApp Cluster FC Port Write Ops | s | Number of write I/O operations performed on a FC Port |
| netapp_fcp_TotalOps | NetApp Cluster FC Port Total Ops | s | Performance metric aggregated over all types of I/O operations of an FC Port |
| netapp_fcp_OtherOps | NetApp Cluster FC Port Other Ops | s | Number of other operations performed on cluster. Other I/O operations can be metadata operations, such as directory lookups and so on |
| netapp_fcp_IsAdministrativeUp | NetApp Cluster FC Port Administratice Status | Number of other operations performed on cluster. Other I/O operations can be metadata operations, such as directory lookups and so on | |
| netapp_ethernet_port_State | NetApp Cluster Net Port State | Net-Port Status. Possible states are up, down | |
| netapp_ethernet_port_ReadThroughPut | NetApp Cluster Net Port Read ThroughPut | Bps | Read Throughput for all read I/O operations |
| netapp_ethernet_port_WriteThroughPut | NetApp Cluster Net Port Write ThroughPut | Bps | WriteThroughput for all write I/O operations |
| netapp_ethernet_port_TotalThroughPut | NetApp Cluster Net Port Total ThroughPut | Bps | Total Throughput for all types of I/O operations |
| netapp_ethernet_port_LinkDownCount | NetApp Cluster Net Port Link Down Count | count | The number of link state changes from up to down seen on the device |
| netapp_ethernet_port_ReceivedPackets | NetApp Cluster Net Port Received Packets | count | Number of packets received |
| netapp_ethernet_port_TransmittedPackets | NetApp Cluster Net Port Transmitted Packets | count | Number of packets transmitted |
| netapp_ethernet_port_IsAdministrativeUp | NetApp Cluster Net Port Administrative Status | Administrative status of the Port | |
| netapp_fc_interface_State | NetApp Cluster FC Interface State | The current operational state of the FC interface. The state is set to down if the interface is not enabled.If the node hosting the port is down or unavailable, no state value is returned. | |
| netapp_fc_interface_ReadThroughPut | NetApp Cluster FC Interface Read ThroughPut | Bps | Read Throughput for all read I/O operations of an FC Interface |
| netapp_fc_interface_WriteThroughPut | NetApp Cluster FC Interface Write ThroughPut | Bps | WriteThroughput for all write I/O operations of an FC Interface |
| netapp_fc_interface_TotalThroughPut | NetApp Cluster FC Interface Total ThroughPut | Bps | Total Throughput for all types of I/O operations of an FC Interface |
| netapp_fc_interface_ReadLatency | NetApp Cluster FC Interface Read Latency | microsec | Latency for all read operations in microseconds |
| netapp_fc_interface_WriteLatency | NetApp Cluster FC Interface Write Latency | microsec | Latency for all write operations system in microseconds |
| netapp_fc_interface_TotalLatency | NetApp Cluster FC Interface Total Latency | microsec | Latency for all total operations in microseconds |
| netapp_fc_interface_OtherLatency | NetApp Cluster FC Interface Other Latency | microsec | Latency for all other operations in microseconds |
| netapp_fc_interface_ReadOps | NetApp Cluster FC Interface Read Ops | s | Number of read I/O operations performed on the FC Port |
| netapp_fc_interface_WriteOps | NetApp Cluster FC Interface Write Ops | s | Number of write I/O operations performed on a FC Port |
| netapp_fc_interface_TotalOps | NetApp Cluster FC Interface Total Ops | s | Performance metric aggregated over all types of I/O operations of an FC Port |
| netapp_fc_interface_OtherOps | NetApp Cluster FC Interface Other Ops | s | Number of other operations performed on cluster. Other I/O operations can be metadata operations, such as directory lookups and so on |
| netapp_fc_interface_IsAdministrativeUp | NetApp Cluster FC Interface Administratice Status | The administrative state of the FC interface. The FC interface can be disabled to block all FC communication with the SVM through this interface | |
| netapp_lif_interface_ReadThroughPut | NetApp Cluster Interface Read ThroughPut | Bps | Read Throughput for all read I/O operations of an Interface |
| netapp_lif_interface_WriteThroughPut | NetApp Cluster Interface Write ThroughPut | Bps | WriteThroughput for all write I/O operations of an Interface |
| netapp_lif_interface_TotalThroughPut | NetApp Cluster Interface Total ThroughPut | Bps | Total Throughput for all types of I/O operations of an Interface |
| netapp_lif_interface_State | NetApp Cluster Interface State | Returns Interface state. Possible states are up, down | |
| netapp_vserver_State | NetApp Cluster vServer State | vServer State.Possible states are starting, running, stopping, stopped, deleting | |
| netapp_vserver_nfsv3_ReadOps | NetApp vServer NFSV3 Read Ops | s | Number of read I/O operations performed |
| netapp_vserver_nfsv3_WriteOps | NetApp vServer NFSV3 Write Ops | s | Number of write I/O operations performed |
| netapp_vserver_nfsv3_TotalOps | NetApp vServer NFSV3 Total Ops | s | Performance metric aggregated over all types of I/O operations |
| netapp_vserver_nfsv3_OtherOps | NetApp vServer NFSV3 Other Ops | s | Number of other operations performed. Other I/O operations can be metadata operations, such as directory lookups and so on |
| netapp_vserver_cifs_ReadThroughPut | NetApp vServer CIFS Read ThroughPut | Bps | Read Throughput for all read I/O operation |
| netapp_vserver_cifs_WriteThroughPut | NetApp vServer CIFS Write ThroughPut | Bps | WriteThroughput for all write I/O operations |
| netapp_vserver_cifs_TotalThroughPut | NetApp vServer CIFS Total ThroughPut | Bps | Total Throughput for all types of I/O operations |
| netapp_vserver_cifs_ReadLatency | NetApp vServer CIFS Read Latency | microsec | Latency for all read operations in microseconds |
| netapp_vserver_cifs_WriteLatency | NetApp vServer CIFS Write Latency | microsec | Latency for all write operations system in microseconds |
| netapp_vserver_cifs_TotalLatency | NetApp vServer CIFS Total Latency | microsec | Latency for all total operations in microseconds |
| netapp_vserver_cifs_OtherLatency | NetApp vServer CIFS Other Latency | microsec | Latency for all other operations in microseconds |
| netapp_vserver_cifs_ReadOps | NetApp vServer CIFS Read Ops | s | Number of read I/O operations performed |
| netapp_vserver_cifs_WriteOps | NetApp vServer CIFS Write Ops | s | Number of write I/O operations performed |
| netapp_vserver_cifs_TotalOps | NetApp vServer CIFS Total Ops | s | Performance metric aggregated over all types of I/O operations |
| netapp_vserver_cifs_OtherOps | NetApp vServer CIFS Other Ops | s | Number of other operations performed. Other I/O operations can be metadata operations, such as directory lookups and so on |
| netapp_vserver_iscsi_ReadThroughput | NetApp vServer ISCSI Read ThroughPut | Bps | Read Throughput for all read I/O operation |
| netapp_vserver_iscsi_WriteThroughput | NetApp vServer ISCSI Write ThroughPut | Bps | WriteThroughput for all write I/O operations |
| netapp_vserver_iscsi_TotalThroughput | NetApp vServer ISCSI Total ThroughPut | Bps | Total Throughput for all types of I/O operations |
| netapp_vserver_iscsi_ReadOps | NetApp vServer ISCSI Read Latency | s | Latency for all read operations in microseconds |
| netapp_vserver_iscsi_WriteOps | NetApp vServer ISCSI Write Latency | s | Latency for all write operations system in microseconds |
| netapp_vserver_iscsi_TotalOps | NetApp vServer ISCSI Total Latency | s | Latency for all total operations in microseconds |
| netapp_vserver_iscsi_OtherOps | NetApp vServer ISCSI Other Latency | s | Latency for all other operations in microseconds |
| netapp_vserver_iscsi_OtherOps | NetApp vServer ISCSI Other Latency | s | Latency for all other operations in microseconds |
| netapp_vserver_iscsi_ReadLatency | NetApp vServer ISCSI Read Ops | microsec | Number of read I/O operations performed |
| netapp_vserver_iscsi_WriteLatency | NetApp vServer ISCSI Write Ops | microsec | Number of write I/O operations performed |
| netapp_vserver_iscsi_TotalLatency | NetApp vServer ISCSI Total Ops | microsec | Performance metric aggregated over all types of I/O operations |
| netapp_vserver_iscsi_OtherLatency | NetApp vServer ISCSI Other Ops | microsec | Number of other operations performed. Other I/O operations can be metadata operations, such as directory lookups and so on |
| netapp_volume_FilesTotal | NetApp Cluster Volume Files Total | count | The maximum number of files (inodes) for user-visible data allowed on the volume |
| netapp_volume_FilesUsed | NetApp Cluster Volume Files Used | count | Number of user-visible files (inodes) used |
| netapp_volume_SizeTotal | NetApp Cluster Volume Size Total | GB | Total provisioned size. The default size is equal to the minimum size of 20MB, in bytes |
| netapp_volume_SizeAvailable | NetApp Cluster Volume Size Available | GB | The available space in volume, in bytes. |
| netapp_volume_SizeUsed | NetApp Cluster Volume Size Used | GB | The virtual space used (includes volume reserves) before storage efficiency, in bytes. |
| netapp_volume_SnapshotReserveSizeUsed | NetApp Cluster Volume Snapshot Reserve Size Used | GB | The total space used by Snapshot copies in the volume, in bytes. |
| netapp_volume_PercentageSnapshotsReserved | NetApp Cluster Volume Percentage Snapshot Reserved | % | The space that has been set aside as a reserve for Snapshot copy usage, in percent |
| netapp_volume_Footprint | NetApp Cluster Volume FootPrint | GB | Data used for this volume in the aggregate, in bytes |
| netapp_volume_Metadata | NetApp Cluster Volume MetaData | GB | Space used by the volume metadata in the aggregate, in bytes |
| netapp_volume_LogicalSpaceUsedByAfs | NetApp Cluster Volume Logical Space USed By AFS | GB | The virtual space used by AFS alone (includes volume reserves) and along with storage efficiency, in bytes |
| netapp_volume_CompressionState | NetApp Cluster Volume Compression State | The system can be enabled/disabled compression. Possible states are inline, background, both, none and mixed | |
| netapp_volume_DeduplicationState | NetApp Cluster Volume Deduplication State | The system can be enabled/disabled dedupe. Possible states are inline, background, both, none and mixed | |
| netapp_volume_CrossVolumeDeduplicationState | NetApp Cluster Volume Cross Voume Deduplication State | The system can be enabled/disabled cross volume dedupe. it can be enabled only when dedupe is enabled. Possible states are inline, background, both, none, mixed | |
| netapp_volume_CompactionState | NetApp Cluster Volume Compaction State | The system can be enabled/disabled compaction. Possible states are inline, none, mixed | |
| netapp_volume_QuotaState | NetApp Cluster Volume Quota State | Quota state of the volume. Possible states are corrupt, initializing, mixed, off, on, resizing | |
| netapp_volume_GrowThresholdPercentage | NetApp Cluster Volume Grow Threshold | % | Used space threshold size, in percentage, for the automatic growth of the volume. When the amount of used space in the volume becomes greater than this threhold, the volume automatically grows unless it has reached the maximum size |
| netapp_volume_ShrinkThresholdPercentage | NetApp Cluster Volume Shrink Threshold | % | Used space threshold size, in percentage, for the automatic shrinkage of the volume. When the amount of used space in the volume drops below this threshold, the volume automatically shrinks unless it has reached the minimum size |
| netapp_volume_State | NetApp Cluster Volume State | State of the volume. Possible states are error, mixed, offline, online | |
| netapp_volume_OtherLatency | NetApp Cluster Volume Other Latency | microsec | Latency for all other operations on the volume. Other operations include metadata and directory lookups |
| netapp_volume_TotalLatency | NetApp Cluster Volume Total Latency | microsec | Latency for all the operations on the volume |
| netapp_volume_ReadLatency | NetApp Cluster Volume Read Latency | microsec | Time taken for reads operations to the volume |
| netapp_volume_WriteLatency | NetApp Cluster Volume Write Latency | microsec | Time for writes operations to the volume |
| netapp_volume_OtherOps | NetApp Cluster Volume Other Ops | s | Number of other operations performed by the volume |
| netapp_volume_TotalOps | NetApp Cluster Volume Total Ops | s | Number of operations performed by the volume |
| netapp_volume_ReadOps | NetApp Cluster Volume Read Ops | s | Number of read operations performed by the volume |
| netapp_volume_WriteOps | NetApp Cluster Volume Write Ops | s | Number of write operations performed by the volume |
| netapp_volume_OtherThroughput | NetApp Cluster Volume Other ThroughPut | Bps | Other Throughput for all other I/O operations. Other I/O operations can be metadata operations, such as directory lookups |
| netapp_volume_TotalThroughput | NetApp Cluster Volume Total ThroughPut | Bps | Total Throughput for all I/O operations on the volume |
| netapp_volume_ReadThroughput | NetApp Cluster Volume Read ThroughPut | Bps | Read Throughput for all other I/O operations. |
| netapp_volume_WriteThroughput | NetApp Cluster Volume Write ThroughPut | Bps | Write Throughput for all types of I/O operations |
| netapp_volume_InodeUtilization | NetApp Cluster Volume Inode Utilization | % | Percentage of volume iNode utilization |
| netapp_volume_PercentageSizeUsed | NetApp Cluster Volume Utilization | % | Percentage of the volume size that is used. This field is valid only when the volume is online. |
| netapp_volume_SnapshotCount | Netapp Cluster Volume Snapshot Count | count | Volume SnapShot Count |
| netapp_volume_TooOldSnapshot | Netapp Cluster Volume Too Old Snapshot | Days | Specifies the age of a Snapshot copy, which, if exceeded, is considered too old for the volume |
| netapp_volume_QuotaToalFilesUsed | NetApp Cluster Volume Quota Total Files Used | count | Total files used |
| netapp_volume_QuotaSpaceHardLimit | NetApp Cluster Volume Quota Space Hard Limit | Bytes | Space hard limit in bytes |
| netapp_volume_QuotaSpaceHardLimitPercentageUsed | NetApp Cluster Volume Quota Space Hard Limit Percntage Used | % | Total space used as a percentage of space soft limit |
| netapp_volume_QuotaToalSpaceUsed | NetApp Cluster Volume Quota Total Space Used | GB | Total space used |
| netapp_volume_AvgLatency | NetApp Cluster Volume Average Latency | microsec | NetApp Cluster Volume Average Latency |
| netapp_volume_AvgReadLatency | NetApp Cluster Volume Average Read Latency | microsec | NetApp Cluster Volume Average Read Latency |
| netapp_volume_AvgWriteLatency | NetApp Cluster Volume Average Write Latency | microsec | NetApp Cluster Volume Average Write Latency |
| netapp_volume_AvgOtherLatency | NetApp Cluster Volume Average Other Latency | microsec | NetApp Cluster Volume Average Other Latency |
| netapp_volume_AvgOtherOps | NetApp Cluster Volume Average Other Ops | s | NetApp Cluster Volume Average Other Ops |
| netapp_volume_AvgOps | NetApp Cluster Volume Average Total Ops | s | NetApp Cluster Volume Average Total Ops |
| netapp_volume_AvgReadOps | NetApp Cluster Volume Average Read Ops | s | NetApp Cluster Volume Average Read Ops |
| netapp_volume_AvgWriteOps | NetApp Cluster Volume Average Write Ops | s | NetApp Cluster Volume Average Write Ops |
| netapp_volume_AvgOtherThroughput | NetApp Cluster Volume Average Other ThroughPut | Bps | NetApp Cluster Volume Average Other ThroughPut |
| netapp_volume_AvgThroughput | NetApp Cluster Volume Average ThroughPut | Bps | NetApp Cluster Volume Average ThroughPut |
| netapp_volume_AvgReadThroughput | NetApp Cluster Volume Average Read ThroughPut | Bps | NetApp Cluster Volume Average Read ThroughPut |
| netapp_volume_AvgWriteThroughput | NetApp Cluster Volume Average Write ThroughPut | Bps | NetApp Cluster Volume Average Write ThroughPut |
| netapp_volume_SpaceFullThresholdPercent | NetApp Cluster Volume SpaceFull Threshold Percentage | % | NetApp Cluster Volume SpaceFull Threshold Percentage |
| netapp_qtree_ReadOps | NetApp Volume Qtree Read Ops | s | Number of read I/O operations performed |
| netapp_qtree_WriteOps | NetApp Volume Qtree Write Ops | s | Number of write I/O operations performed |
| netapp_qtree_OtherOps | NetApp Volume Qtree Other Ops | s | Number of other operations performed. Other I/O operations can be metadata operations, such as directory lookups and so on |
| netapp_qtree_TotalOps | NetApp Volume Qtree Total Ops | s | Performance metric aggregated over all types of I/O operations |
| netapp_lun_SizeTotal | NetApp Cluster Lun Size Total | GB | The total provisioned size of the LUN |
| netapp_lun_SizeUsed | NetApp Cluster Lun Size Used | GB | NetApp Cluster Lun Size Used |
| netapp_lun_State | NetApp Cluster LUN State | The state of the LUN. Normal states for a LUN are online and offline. Other states indicate errors.Possible states are foreign_lun_error, nvfail, offline, online, space_error | |
| netapp_lun_OtherLatency | NetApp Cluster LUN Other Latency | microsec | Latency for all other operations on the LUN. Other operations include metadata and directory lookups |
| netapp_lun_TotalLatency | NetApp Cluster LUN Total Latency | microsec | Latency for all Total operations on the LUN |
| netapp_lun_ReadLatency | NetApp Cluster LUN Read Latency | microsec | Latency for all Read operations on the LUN |
| netapp_lun_WriteLatency | NetApp Cluster LUN Write Latency | microsec | Latency for all Write operations on the LUN |
| netapp_lun_OtherOps | NetApp Cluster LUN Other Ops | s | Other operations per second |
| netapp_lun_TotalOps | NetApp Cluster LUN Total Ops | s | Total operations per sec |
| netapp_lun_ReadOps | NetApp Cluster LUN Read Ops | s | Read operations per second |
| netapp_lun_WriteOps | NetApp Cluster LUN Write Ops | s | Write operations per sec |
| netapp_lun_OtherThroughput | NetApp Cluster LUN Other ThroughPut | Bps | Other throughput for all other I/O operations. Other I/O operations can be metadata operations, such as directory lookups |
| netapp_lun_TotalThroughput | NetApp Cluster LUN Total ThroughPut | Bps | Total throughPut in bytes per sec |
| netapp_lun_ReadThroughput | NetApp Cluster LUN Read ThroughPut | Bps | Read bytes per second |
| netapp_lun_WriteThroughput | NetApp Cluster LUN Write ThroughPut | Bps | Write bytes per second |
| netapp_lun_AvgLatency | NetApp Cluster LUN Average Latency | microsec | Avg latency for all the operations on the LUN. |
| netapp_lun_AvgReadLatency | NetApp Cluster LUN Average Read Latency | microsec | Avg latency for all Read operations on the LUN |
| netapp_lun_AvgWriteLatency | NetApp Cluster LUN Average Write Latency | microsec | Avg Latency for all Write operations on the LUN |
| netapp_lun_AvgotherLatency | NetApp Cluster LUN Average Other Latency | microsec | Avg latency for all Other operations performed on the LUN.Other operations include metadata and directory lookups |
| netapp_lun_AvgOtherOps | NetApp Cluster LUN Average Other Ops | s | Avg other operations per second |
| netapp_lun_AvgOps | NetApp Cluster LUN Average Total Ops | s | Avg total operations per sec |
| netapp_lun_AvgReadOps | NetApp Cluster LUN Average Read Ops | s | Avg read operations per second |
| netapp_lun_AvgWriteOps | NetApp Cluster LUN Average Write Ops | s | Avg write operations per sec |
| netapp_lun_AvgOtherThroughput | NetApp Cluster LUN Average Other ThroughPut | Bps | Avg reads in bytes per second |
| netapp_lun_AvgThroughput | NetApp Cluster LUN Average Total ThroughPut | Bps | Avg writes in bytes per second |
| netapp_lun_AvgReadThroughput | NetApp Cluster LUN Average Read ThroughPut | Bps | Avg latency for all the operations on the LUN. |
| netapp_lun_AvgWriteThroughput | NetApp Cluster LUN Average Write ThroughPut | Bps | Avg latency for all Read operations on the LUN |
| netapp_lun_SizePercentageUsed | NetApp Cluster LUN Utilization | % | LUN Utilization |
| netapp_port_Speed | NetApp Cluster Storage Port Speed | Gbps | NetApp Cluster Storage Port Speed |
| netapp_port_Status | NetApp Cluster Storage Port Status | Storage Port Status, Possible status are error(0), online(1) and offline(2) | |
| netapp_shelf_State | NetApp Hardware Shelf State | Returns the status of the Shelf. Possible states are unknown(0), error(1) and ok(2) | |
| netapp_shelf_PortStatus | NetApp Hardware Shelf Port Status | Returns the status of the Ports associated with the shelf. Possible states are disconnected(0), error(1) and connected(2) |
Risks, Limitations & Assumptions
- Application can handle Critical/Recovery failure notifications for below two cases when user enables App Failure Notifications in configuration
- Connectivity Exception
- Authentication Exception
- Application will not send any duplicate/repeat failure alert notification until the already existing critical alert is recovered.
- Using metrics for monitoring the resources and generating alerts when the threshold values are breached.
- Application cannot control monitoring pause/resume actions based on above alerts.
- Since a single NetApp Cluster may contain thousands of resources. At the time of Monitoring we are facing performance issues.
- The api rate limit is 20 (At a point of time we can make 20 api calls only with the cluster).
- No support of showing activity log and applied time.
- No support for the option to get Latest snapshot metric.