| Supported Versions |
|---|
| ONTAP Simulator 9.8 |
| Active IQ Unified manager 9.9 |
Introduction
NetApp Active IQ Unified Manager
NetApp® OnCommand® Unified Manager is a graphical management product that provides comprehensive monitoring and key management capabilities for NetApp ONTAP® systems to help manage the availability, capacity, protection, and performance risks of your storage systems.
You can deploy Unified Manager on a Linux server, on a Windows server, or as a virtual appliance on a VMware host.
Storage resources in a 2-node cluster:
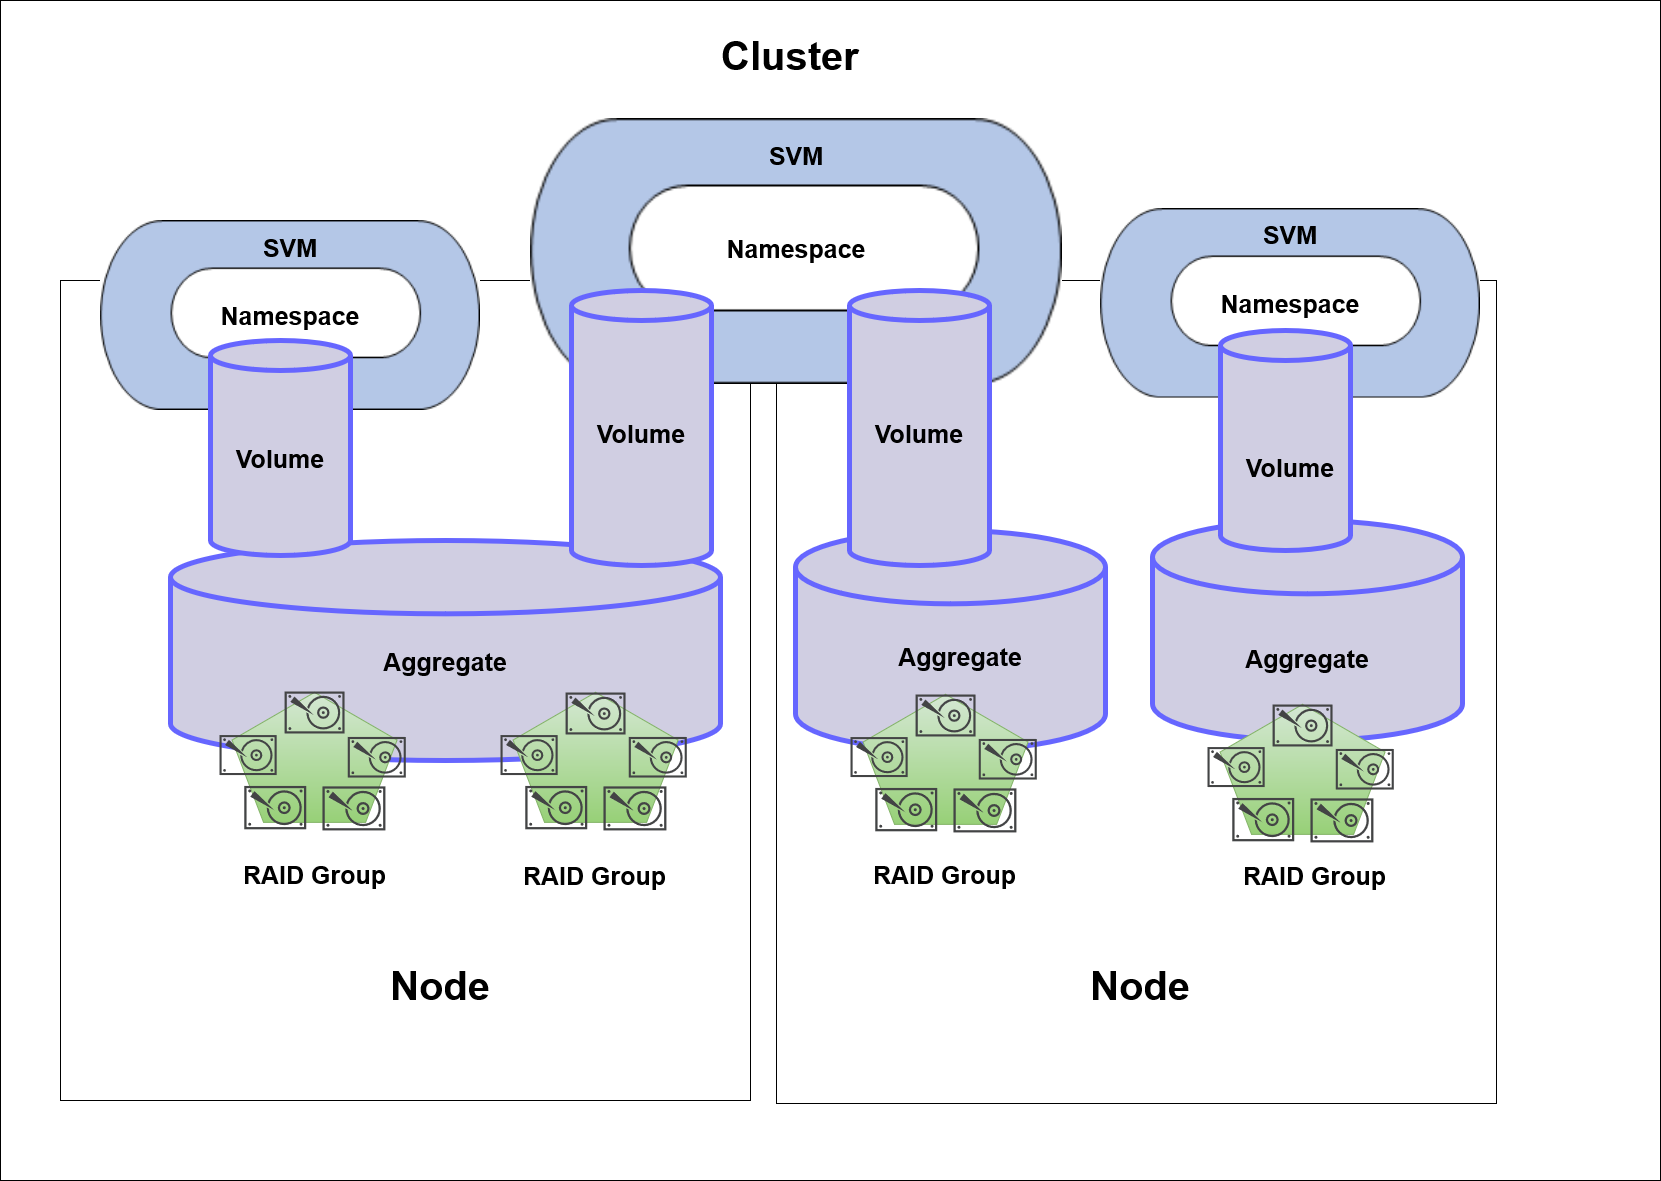
Physical storage resources
Refers to the physical storage objects provided by ONTAP. Physical storage resources include disks, clusters, storage controllers, nodes, and aggregates.
Logical storage resources
Refers to the storage resources provided by ONTAP that are not tied to a physical resource. These resources are associated with a storage virtual machine (SVM, formerly known as Vserver), and they exist independently of any specific physical storage resource such as a disk, array LUN, or aggregate.
Cluster
A cluster consists of one or more nodes grouped together as (HA pairs) to form a scalable cluster. Creating a cluster enables the nodes to pool their resources and distribute work across the cluster, while presenting administrators with a single entity to manage. Clustering also enables continuous service to end users if individual nodes go offline.
Node
A node is a controller in a cluster. It is connected to other nodes in the cluster over a private management cluster network. It is also connected to the disk shelves that provide physical storage for the Data ONTAP system or to third-party storage arrays that provide array LUNs for Data ONTAP use.
Volume
Volumes are data containers that enable you to partition and manage your data. Understanding the types of volumes and their associated capabilities enables you to design your storage architecture for maximum storage efficiency and ease of administration.
Volumes are the highest-level logical storage object. Unlike aggregates, which are composed of physical storage resources, volumes are completely logical objects.
Aggregate
An aggregate is a collection of disks (or partitions) arranged into one or more RAID groups. It is the most basic storage object within ONTAP and is required to allow for the provisioning of space for connected hosts.
SVM
Storage Virtual Machines (SVMs) contain data volumes and one or more LIFs (logical interfaces) through which they serve data to the clients.
A cluster can have one or more SVMs with FlexVol volumes and SVMs with Infinite Volume.
Namespace
A namespace is a logical grouping of volumes that are joined together at junction points to create a single, logical file system that derives from the Storage Virtual Machine (SVM) root volume. Each SVM has a namespace.
Prerequisites
- The OpsRamp Gateway must be installed.
- Hardware: VMware ESXi with 2 VMs - Memory 8GB , CPU’s 2 No’s, Hard Disk 50 GB for each VM.
- Software: ONTAP Simulator 9.8 & Active IQ Unified manager 9.9- Available.
Resource Hierarchy
NetApp Active Iq Unified Manager
NetApp Cluster
→ Cluster Nodes → Aggregates → Storage Ports → Ethernet Ports → Logical Interfaces(LIF’s) → FCP Adapters → FC Interfaces → Storage Virtual Machine/SVM → Storage Volumes → Storage Luns → QTrees → Disks → Shelves
Configure and install the integration
- Go to Setup > Integrations and Apps.
- Click + ADD on the INSTALLED APP page. The ADD APP page displays all the available applications along with the newly created application with the version.
Notes:- If there are already installed applications, it will redirect to the INSTALLED APPS page, where all the installed applications are displayed.
- If there are no installed applications, it will navigate to the ADD APP page.
- You can even search for the application using the search option available. Also you can use the All Categories option to search.
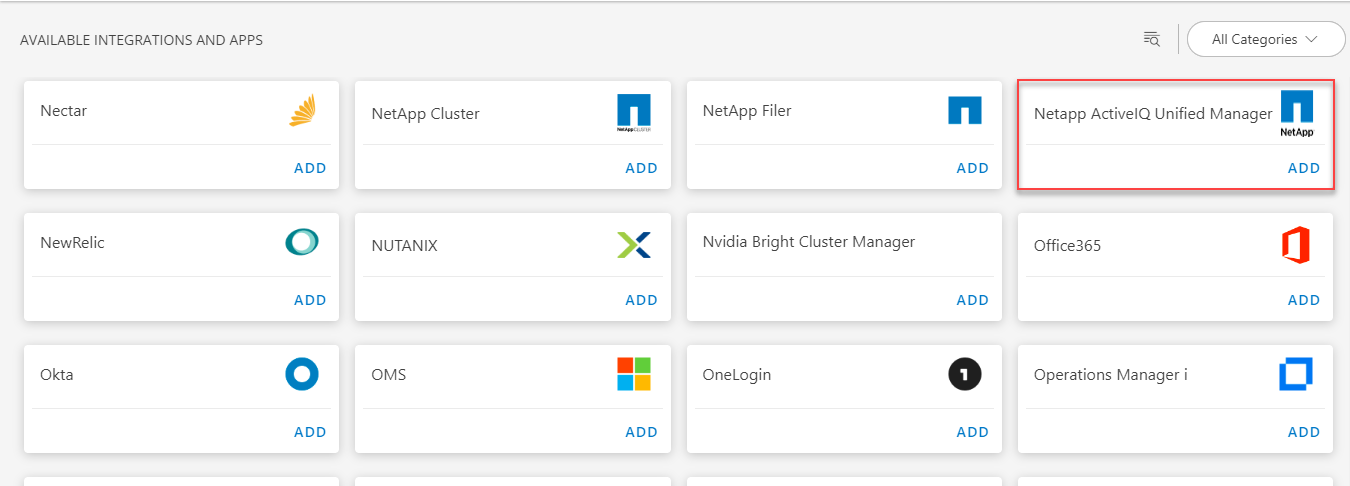
- Click ADD in the Netapp ActiveIQ Unified Manager application.
- In the Configurations page, click + ADD. The Add Configuration page appears.
- Enter the below mentioned BASIC INFORMATION
| Functionality | Description |
|---|---|
| Name | Enter the name for the configuration |
| IP Address/Host Name | IP address/host name of the target. |
| Port | Port. Example: By default 443 is selected. |
| NetApp Active Iq Credentials | Select the credentials from the drop-down list. Note: Click + Add to create a credential. |
Notes:
- By default the Is Secure checkbox is selected.
- App Failure Notifications: if turned on, you will be notified in case of an application failure that is, Connectivity Exception, Authentication Exception.
- Alert Configuration: map alert configuration for third party alerts into OpsRamp.
- Alert On Root Resource: Alerts generated on root resource.
- Below are the default values set for:
- Alert Severity: possible values of Alert Severity Filter configuration property are new,obsolete,acknowledged,resolved.
- Alert Severity Mapping: possible values of Alert Severity Mapping Filter configuration property are “new”:{“critical”: “Critical”,“error”: “Critical”,“warning”: “Warning”,“information”: “Info”,“normal”: “Info”},“acknowledged”: {“critical”: “Critical”,“error”: “Critical”,“warning”: “Warning”,“information”: “Info”,“normal”: “Info”},“obsolete”: {“critical”: “Ok”,“error”: “Ok”,“warning”: “Ok”,“information”: “Ok”,“normal”: “Ok”},“resolved”: {“critical”: “Ok”,“error”: “Ok”,“warning”: “Ok”,“information”: “Ok”,“normal”: “Ok”.
In the RESOURCE TYPE section, select:
- ALL: All the existing and future resources will be discovered.
- SELECT: You can select one or multiple resources to be discovered.
In the DISCOVERY SCHEDULE section, select Recurrence Pattern to add one of the following patterns:
- Minutes
- Hourly
- Daily
- Weekly
- Monthly
Click ADD.
Now the configuration is saved and displayed on the configurations page after you save it.
Note: From the same page, you may Edit and Remove the created configuration.Click NEXT.
In the Installation page, select an existing registered gateway profile, and click FINISH.
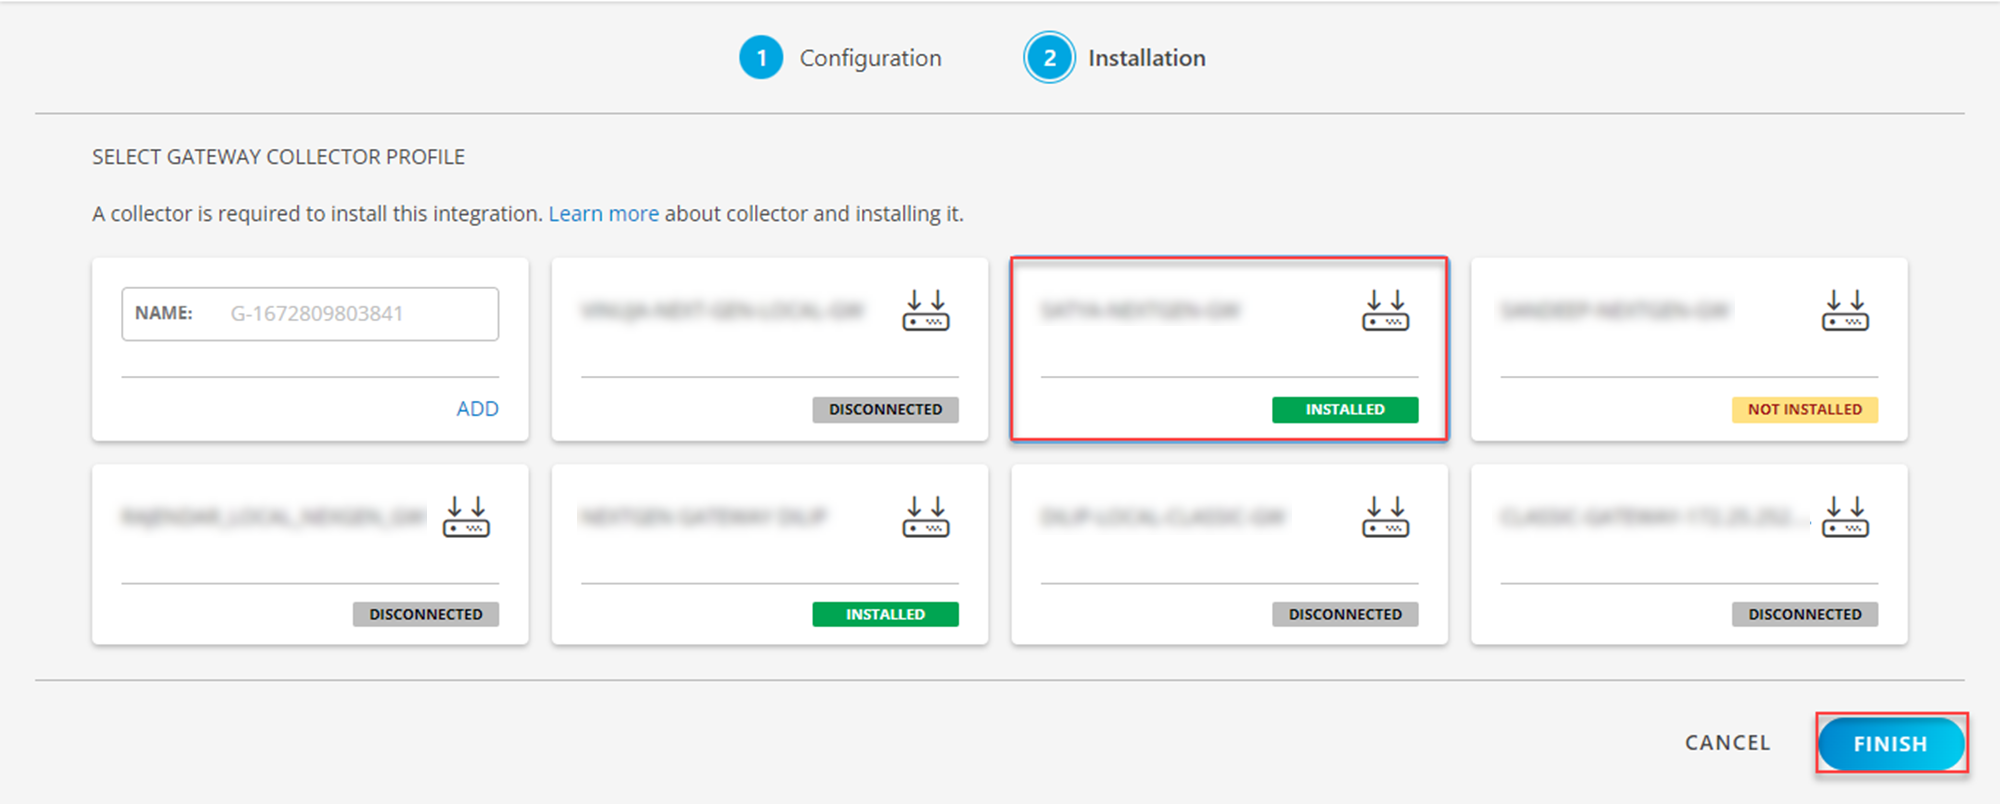
The application is now installed and displayed on the INSTALLED INTEGRATION page. Use the search field to find the installed application.
Modify the Configuration
See Modify an Installed Integration or Application article.
Note: Select the NetApp Active IQ Unified Manager application.
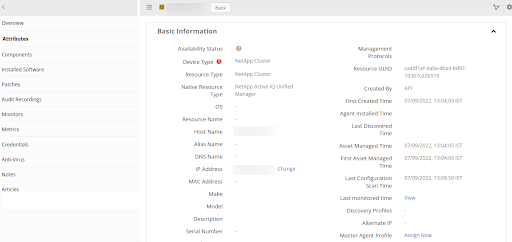
View the NetApp Active IQ details
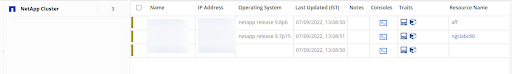
The discovered resource(s) are displayed in Infrastructure > Resources > Storage > NetApp Cluster > Resources. You can navigate to the Attributes tab to view the discovery details, and Metrics tab to view the metric details for NetApp Active IQ.
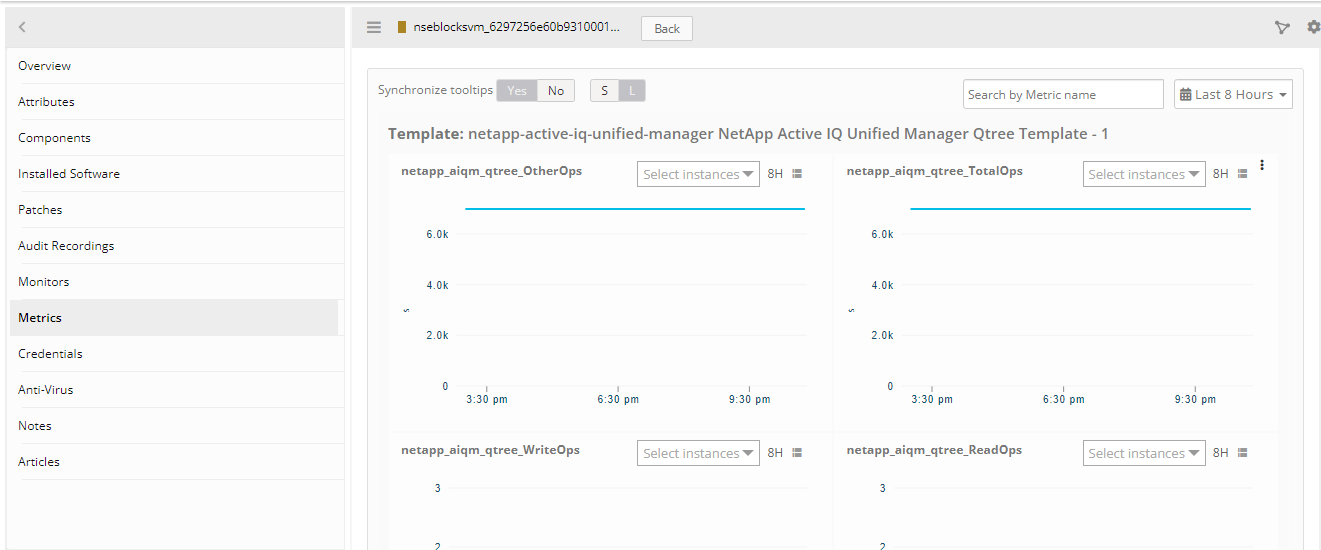
View resource metrics
To confirm NetApp Active IQ monitoring, review the following:
- Metric graphs: A graph is plotted for each metric that is enabled in the configuration.
- Alerts: Alerts are generated for metrics that are configured as defined for integration.
Supported Metrics
| Metric Name | Metric Display Name | Units | Description |
|---|---|---|---|
| netapp_aiqm_cluster_hardware_HealthStatus | Cluster Hardware Health Status | Returns the status of the Hardware Components of the Cluster. Possible states are unknown(0), unreachable(1), degraded(2), ok-with-suppressed(3) and ok(4) | |
| netapp_aiqm_cluster_Iops | Cluster Iops | Req per Sec | Average number of input/output operations the cluster processes per second. |
| netapp_aiqm_cluster_Throuhput | Cluster ThroughPut | Mbps | Number of bytes of data transferred to and from this cluster per second. |
| netapp_aiqm_cluster_ClusterPeerStatus | Peer Cluster Status | Returns the state of the peer cluster. Possible states are unidentified(0), unavailable(1), available(2), partial(3) and pending(4) | |
| netapp_aiqm_cluster_system_SizeAvailable | Cluster System Size Available | GB | System Available size.Sum of the available size of all the aggregates in a cluster |
| netapp_aiqm_cluster_system_Utilization | Cluster System Utilization | % | System Utilization.Percentage space used of all the aggregates in a cluster |
| netapp_aiqm_cluster_snapmirror_Status | SnapMirror Status | SnapMirror state.Possible states are broken_off(0), out_of_sync(1), uninitialized(2), paused(3), snapmirrored(4), in_sync(5) and synchronizing(6) | |
| netapp_aiqm_cluster_snapmirror_LagTime | SnapMirror LagTime | ms | Time since the exported Snapshot copy was created |
| netapp_aiqm_node_Latency | Node Latency | The response time for all I/O requests, expressed in microseconds per operation | |
| netapp_aiqm_node_Throughput | Node ThroughPut | Mbps | The throughput on the node, measured in bytes per second. |
| netapp_aiqm_node_Iops | Node Iops | Req per Sec | Number of input/output operations per second on the node |
| netapp_aiqm_node_UpTime | Node Up Time | s | Total time in seconds that the node has been up |
| netapp_aiqm_node_ControllerOverTemperature | Node Controller Over Temperature | Node Controller Over Temperature. Possible values are over(0), normal(1) | |
| netapp_aiqm_node_Status | Node Status | State of the Node. Possible states are unknown(0), degraded(1), down(2), up(3), booting(4), waiting_for_giveback(5) and taken_over(6) | |
| netapp_aiqm_node_FrusStatus | Node Frus Status | State of List of FRUs on the node.Possible values are ok(1), error(0) | |
| netapp_aiqm_node_ServiceProcessorStatus | Node ServiceProcessor Status | State of the service processor on the node.Possible states are unknown(0), degraded(1), offline(2), node_offline(3), sp_daemon_offline(4), online(5), rebooting(6) and updating(7) | |
| netapp_aiqm_node_ServiceProcessorLinkStatus | Node ServiceProcessor Link Status | Service Processor Link status on the Node.Possible states are unknown(0), disabled(1), down(2) and up(3) | |
| netapp_aiqm_node_CpuUtilization | Node Cpu Utilization | % | Node Cpu Utilization |
| netapp_aiqm_node_HaPortStatus | Node HaPort Status | Node HA Port State.Possible states are initialized(0), armed(1), down(2), active(3) and reserved(4) | |
| netapp_aiqm_node_TakeOverStatus | Node TakeOver Status | Represents the state of the node that is taking over storage from its HA partner. Possible states are not_possible(0), in_takeover(1), not_attempted(2), failed(3) and in_progress(4) | |
| netapp_aiqm_node_GiveBackStatus | Node GiveBack Status | Represents the state of the node that is giving storage back to its HA partner.Possible states are nothing_to_giveback(0), not_attempted(1), in_progress(2) and failed(3) | |
| netapp_aiqm_aggregate_Status | Aggregate Status | operational State of the Aggregate. Possible states are unknown(0), failed(1), offline(2), offlining(3), unmounted(4), inconsistent(5), online(6), onlining(7), relocating(8) and restricted(9) | |
| netapp_aiqm_aggregate_SizeUsed | Aggregate Used Size | GB | Space used on the Aggregate |
| netapp_aiqm_aggregate_SizeTotal | Aggregate Total Size | GB | Total usable space not including WAFL reserve and aggregate Snapshot copy reserve |
| netapp_aiqm_aggregate_SizeAvailable | Aggregate Available Size | GB | Number of input/output operations per second on the node |
| netapp_aiqm_aggregate_PercentageUsedCapacity | Aggregate Utilization | % | Percentage used Capacity of an Aggregate |
| netapp_aiqm_aggregate_SpaceFullThresholdPercent | Aggregate SpaceFull Threshold Percentage | % | Spacefull Threshold Percentage of an Aggregate |
| netapp_aiqm_aggregate_InactiveUserData | Aggregate Inactive User Data | GB | The size that is physically used in the block storage and has a cold temperature.only supported if the aggregate is either attached to a cloud store or can be attached to a cloud store. |
| netapp_aiqm_aggregate_MirrorStatus | Aggregate Mirror Status | Aggregate Mirror State. Possible states are failed(0), degraded(1), unmirrored(2), normal(3) and resynchronizing(4) | |
| netapp_aiqm_aggregate_DiskCount | Aggregate Disk Count | count | Number of disks used in the aggregate. This includes parity disks, but excludes disks in the hybrid cache |
| netapp_aiqm_aggregate_RaidSize | Aggregate Raid Size | count | Specifies the maximum number of disks that can be included in a RAID group. |
| netapp_aiqm_aggregate_Throughput | Aggregate ThroughPut | Mbps | The throughput on the aggregates, measured in bytes per second. |
| netapp_aiqm_aggregate_Iops | Aggregate Iops | Req per Sec | The average input/output operations per second on the aggregates |
| netapp_aiqm_aggregate_Latency | Aggregate Latency | microsec | The average response time for all I/O requests, expressed in microseconds per operation. |
| netapp_aiqm_aggregate_SnapshotReservePercent | Aggregate Snapshot Reseve Percentage | % | Aggregate Snapshot Reserve percentage |
| netapp_aiqm_aggregate_OverCommitment | Aggregate Over Commitment | % | Aggregate has had more space allocated to volumes than the amount of usable space in the aggregate |
| netapp_aiqm_disk_Status | Disk Status | Disk State. Possible states are broken(0), pending(1), removed(2), partner(3), copy(4), present(5), reconstructing(6), maintenance(7), spare(8), unfail(9) and zeroing(10) | |
| netapp_aiqm_disk_SizeAvailable | Disk Available Size | GB | Disk Available Size |
| netapp_aiqm_fcp_Status | FCP Status | FC Port State.Possible states are unknown(0), node_offline(1), offlined_by_system(2), offlined_by_user(3), link_disconnected(4), link_not_connected(5), startup(6) and online(7) | |
| netapp_aiqm_fcp_ReadThroughPut | FCP Read ThroughPut | Bps | Read Throughput for all read I/O operations of an FC Port |
| netapp_aiqm_fcp_WriteThroughPut | FCP Write ThroughPut | Bps | WriteThroughput for all write I/O operations of an FC Port |
| netapp_aiqm_fcp_TotalThroughPut | FCP Total ThroughPut | Bps | Total Throughput for all types of I/O operations of an FC Port |
| netapp_aiqm_fcp_ReadLatency | FCP Read Latency | microsec | The response time for all read I/O requests, expressed in microseconds |
| netapp_aiqm_fcp_WriteLatency | FCP Write Latency | microsec | The response time for all write I/O requests, expressed in microseconds |
| netapp_aiqm_fcp_TotalLatency | FCP Total Latency | microsec | The response time for all I/O requests, expressed in microseconds |
| netapp_aiqm_fcp_OtherLatency | FCP Other Latency | microsec | The response time for all other I/O requests, expressed in microseconds |
| netapp_aiqm_fcp_ReadOps | FCP Read Ops | s | Number of read I/O operations performed on the FC Port |
| netapp_aiqm_fcp_WriteOps | FCP Write Ops | s | Number of write I/O operations performed on a FC Port |
| netapp_aiam_fcp_TotalOps | FCP Total Ops | s | Performance metric aggregated over all types of I/O operations of an FC Port |
| netapp_aiqm_fcp_OtherOps | FCP Other Ops | s | Number of other operations performed on cluster. Other I/O operations can be metadata operations, such as directory lookups and so on |
| netapp_aiqm_fcp_IsAdministrativeUp | FCP Administrative Status | The administrative state of the FC port. If this property is set to false, all FC connectivity to FC interfaces are blocked. Possible states false(0) and true(1) | |
| netapp_aiqm_ethernet_port_Status | EthernetPort Status | Net-Port Status. Possible states are down(0) and up(1) | |
| netapp_aiqm_ethernet_port_ReadThroughPut | EthernetPort Read ThroughPut | Bps | Read Throughput for all read I/O operations |
| netapp_aiqm_ethernet_port_WriteThroughPut | EthernetPort Write ThroughPut | Bps | WriteThroughput for all write I/O operations |
| netapp_aiqm_ethernet_port_TotalThroughPut | EthernetPort Total ThroughPut | Bps | Total Throughput for all types of I/O operations |
| netapp_aiqm_ethernet_port_LinkDownCount | EthernetPort Link Down Count | count | The number of link state changes from up to down seen on the device |
| netapp_aiqm_ethernet_port_ReceivedPackets | EthernetPort Packets Received | count | Number of packets received |
| netapp_aiqm_ethernet_port_TransmittedPackets | EthernetPort Packets Transmitted | count | Number of packets transmitted |
| netapp_aiqm_ethernet_port_IsAdministrativeUp | EthernetPort Adinistrative Status | count | Administrative status of the Port. Possible states are false(0) and true(1) |
| netapp_aiqm_lif_interface_Status | LIF Interface Status | Returns Interface state. Possible states are up(1), down(0) | |
| netapp_aiqm_lif_interface_ReadThroughPut | LIF Interface Read ThroughPut | Bps | Read Throughput for all read I/O operations of an Interface |
| netapp_aiqm_lif_interface_WriteThroughPut | LIF Interface Write ThroughPut | Bps | WriteThroughput for all write I/O operations of an Interface |
| netapp_aiqm_lif_interface_TotalThroughPut | LIF Interface Total ThroughPut | Bps | Total Throughput for all types of I/O operations of an Interface |
| netapp_aiqm_fc_interface_Status | FC Interface Status | The current operational state of the FC interface. The state is set to down if the interface is not enabled.If the node hosting the port is down or unavailable, no state value is returned.Possible states can be returned are down(0) and up(1) | |
| netapp_aiqm_fc_interface_ReadThroughPut | FC Interface Read ThroughPut | Bps | Read Throughput for all read I/O operations of an FC Interface |
| netapp_aiqm_fc_interface_WriteThroughPut | FC Interface Write ThroughPut | Bps | WriteThroughput for all write I/O operations of an FC Interface |
| netapp_aiqm_fc_interface_TotalThroughPut | FC Interface Total ThroughPut | Bps | Total Throughput for all types of I/O operations of an FC Interface |
| netapp_aiqm_fc_interface_ReadLatency | FC Interface Read Latency | microsec | The response time for all read I/O requests, expressed in microseconds |
| netapp_aiqm_fc_interface_WriteLatency | FC Interface Write Latency | microsec | The response time for all write I/O requests, expressed in microseconds |
| netapp_aiqm_fc_interface_TotalLatency | FC Interface Total Latency | microsec | The response time for all I/O requests, expressed in microseconds |
| netapp_aiqm_fc_interface_OtherLatency | FC Interface Other Latency | microsec | The response time for all other I/O requests, expressed in microseconds |
| netapp_aiqm_fc_interface_ReadOps | FC Interface Read Ops | s | Number of read I/O operations performed on the FC Interface |
| netapp_aiqm_fc_interface_WriteOps | FC Interface Write Ops | s | Number of write I/O operations performed on a FC Interface |
| netapp_aiqm_fc_interface_TotalOps | FC Interface Total Ops | s | Performance metric aggregated over all types of I/O operations of an FC Interface |
| netapp_aiqm_fc_interface_OtherOps | FC Interface Other Ops | s | Number of other operations performed. Other I/O operations can be metadata operations, such as directory lookups and so on |
| netapp_aiqm_fc_interface_IsAdministrativeUp | FC Interface Administrative Status | The administrative state of the FC interface. The FC interface can be disabled to block all FC communication with the SVM through this interfacePossible returned values are false(0) and true(1) | |
| netapp_aiqm_vserver_Status | SVM Status | vServer /SVM Status.Possible states are starting(0), running(1), stopping(2), stopped(3) and deleting(4) | |
| netapp_aiqm_vserver_Iops | SVM Iops | Req per Sec | Number of input/output operations per second on the SVM |
| netapp_aiqm_vserver_Latency | SVM Latency | microsec | The average response time for all I/O requests, expressed in microseconds per operation. |
| netapp_aiqm_vserver_Throughput | SVM ThroughPut | Mbps | The throughput on the SVM, measured in bytes per second. |
| netapp_aiqm_vserver_nfsv3_ReadOps | SVM NFSV3 Read Ops | s | Number of nfsv3 read input/output operations per second |
| netapp_aiqm_vserver_nfsv3_WriteOps | SVM NFSV3 Write Ops | s | Number of nfsv3 write input/output operations per second |
| netapp_aiqm_vserver_nfsv3_TotalOps | SVM NFSV3 Total Ops | s | Number of nfsv3 toal input/output operations per second |
| netapp_aiqm_vserver_nfsv3_OtherOps | SVM NFSV3 Other Ops | s | Number of nfsv3 write input/output operations per second.Other I/O operations can be metadata operations, such as directory lookups and so on |
| netapp_aiqm_vserver_cifs_ReadThroughPut | SVM CIFS Read ThroughPut | Bps | Cifs Read throughput measured in bytes per second. |
| netapp_aiqm_vserver_cifs_WriteThroughPut | SVM CIFS Write ThroughPut | Bps | Cifs write throughput measured in bytes per second. |
| netapp_aiqm_vserver_cifs_TotalThroughPut | SVM CIFS Total ThroughPut | Bps | Cifs total throughput measured in bytes per second. |
| netapp_aiqm_vserver_cifs_ReadLatency | SVM CIFS Read Latency | microsec | The average response time for all read I/O requests, expressed in microseconds per operation. |
| netapp_aiqm_vserver_cifs_WriteLatency | SVM CIFS Write Latency | microsec | The average response time for all write I/O requests, expressed in microseconds per operation. |
| netapp_aiqm_vserver_cifs_TotalLatency | SVM CIFS Total Latency | microsec | The average response time for all I/O requests, expressed in microseconds per operation. |
| netapp_aiqm_vserver_cifs_OtherLatency | SVM CIFS Other Latency | microsec | The average response time for all other I/O requests, expressed in microseconds per operation.Other I/O operations can be metadata operations, such as directory lookups and so on |
| netapp_aiqm_vserver_cifs_ReadOps | SVM CIFS Read Ops | s | Number of read input/output operations per second |
| netapp_aiqm_vserver_cifs_WriteOps | SVM CIFS Write Ops | s | Number of write input/output operations per second |
| netapp_aiqm_vserver_cifs_TotalOps | SVM CIFS Total Ops | s | Number of total input/output operations per second |
| netapp_aiqm_vserver_cifs_OtherOps | SVM CIFS Other Ops | s | Number of other input/output operations per second |
| netapp_aiqm_vserver_iscsi_ReadThroughPut | SVM ISCSI Read ThroughPut | Bps | Iscsi Read throughput measured in bytes per second |
| netapp_aiqm_vserver_iscsi_WriteThroughput | SVM ISCSI Write ThroughPut | Bps | Iscsi write throughput measured in bytes per second. |
| netapp_aiqm_vserver_iscsi_TotalThroughput | SVM ISCSI Total ThroughPut | Bps | Iscsi total throughput measured in bytes per second. |
| netapp_aiqm_vserver_iscsi_ReadOps | SVM ISCSI Read Ops | s | Number of read input/output operations per second |
| netapp_aiqm_vserver_iscsi_WriteOps | SVM ISCSI Write Ops | s | Number of write input/output operations per second |
| netapp_aiqm_vserver_iscsi_TotalOps | SVM ISCSI Total Ops | s | Number of total input/output operations per second |
| netapp_aiqm_vserver_iscsi_OtherOps | SVM ISCSI Other Ops | s | Number of other input/output operations per second |
| netapp_aiqm_vserver_iscsi_ReadLatency | SVM ISCSI Read Latency | microsec | The average response time for all read I/O requests, expressed in microseconds per operation. |
| netapp_aiqm_vserver_iscsi_WriteLatency | SVM ISCSI Write Latency | microsec | The average response time for all write I/O requests, expressed in microseconds per operation. |
| netapp_aiqm_vserver_iscsi_TotalLatency | SVM ISCSI Total Latency | microsec | The average response time for all I/O requests, expressed in microseconds per operation. |
| netapp_aiqm_vserver_iscsi_OtherLatency | SVM ISCSI Other Latency | microsec | The average response time for all other I/O requests, expressed in microseconds per operation. Other I/O operations can be metadata operations, such as directory lookups and so on |
| netapp_aiqm_volume_Status | Volume Status | The state of the volume that is being exported. Possible State: error(0), offline(1), mixed(2), online(3) | |
| netapp_aiqm_volume_SizeTotal | Volume Total Size | GB | Total provisioned size. The default size is equal to the minimum size of 20MB, in GB |
| netapp_aiqm_volume_SizeAvailable | Volume Available Size | GB | The available space in volume, in GB. |
| netapp_aiqm_volume_SizeUsed | Volume Size Used | GB | Returns the space used in volume, in GB. |
| netapp_aiqm_volume_PercentageSizeUsed | Volume Utilization | Percentage of the volume size that is used. This field is valid only when the volume is online. | |
| netapp_aiqm_volume_FilesTotal | Volume File Total | count | The maximum number of files (inodes) for user-visible data allowed on the volume |
| netapp_aiqm_volume_FilesUsed | Volume Files Used | count | Number of user-visible files (inodes) used |
| netapp_aiqm_volume_InodeUtilization | Volume Inode(Files) Utilization | % | Number of input/output operations per second on the node |
| netapp_aiqm_volume_SnapshotReserveSizeUsed | Volume Snapshots Reserved Size Used | GB | The total space used by Snapshot copies in the volume, in GB. |
| netapp_aiqm_volume_PercentageSnapshotsReserved | Volume Snapshots Reserved Percentage | % | The space that has been set aside as a reserve for Snapshot copy usage, in percent |
| netapp_aiqm_volume_Footprint | Volume FootPrint | GB | Data used for this volume in the aggregate, in GB |
| netapp_aiqm_volume_Metadata | Volume MetaData | GB | Space used by the volume metadata in the aggregate, in GB |
| netapp_aiqm_volume_LogicalSpaceUsedByAfs | Volume Logical Space Used By AFS | GB | The virtual space used by AFS alone (includes volume reserves) and along with storage efficiency, in GB |
| netapp_aiqm_volume_CompressionState | Volume Compression Status | The system can be enabled/disabled compression. Possible states are none(0), inline(1), mixed(2), background(3) and both(4) | |
| netapp_aiqm_volume_DeduplicationState | Volume Deduplication Status | The system can be enabled/disabled dedupe. Possible states are none(0), inline(1), mixed(2), background(3) and both(4) | |
| netapp_aiqm_volume_CrossVolumeDeduplicationState | Volume Cross Deduplication Status | The system can be enabled/disabled cross volume dedupe. it can be enabled only when dedupe is enabled. Possible states are none(0), inline(1), mixed(2), background(3) and both(4) | |
| netapp_aiqm_volume_CompactionState | Volume Compaction State | The system can be enabled/disabled compaction. Possible states are none(0), inline(1) and mixed(2) | |
| netapp_aiqm_volume_QuotaState | Volume Quota State | Quota state of the volume. Possible states are corrupt(0), initializing(1), mixed(2), off(3), on(4) and resizing(5) | |
| netapp_aiqm_volume_GrowThresholdPercentage | Volume Grow Threshold Percentage | % | Used space threshold size, in percentage, for the automatic growth of the volume. When the amount of used space in the volume becomes greater than this threhold, the volume automatically grows unless it has reached the maximum size |
| netapp_aiqm_volume_ShrinkThresholdPercentage | Volume Shrink Threshold Percentage | % | Used space threshold size, in percentage, for the automatic shrinkage of the volume. When the amount of used space in the volume drops below this threshold, the volume automatically shrinks unless it has reached the minimum size |
| netapp_aiqm_volume_Latency | Volume Latency | microsec | The response time for all I/O requests, expressed in microseconds per operation |
| netapp_aiqm_volume_IOps | Volume Iops | Req per Sec | The input/output operations per second for the volume |
| netapp_aiqm_volume_Throughput | Volume ThroughPut | Mbps | Throughput on the volume, measured in bytes per second |
| netapp_aiqm_volume_SnapshotCount | Volume Snapshot Count | count | Volume SnapShot Count |
| netapp_aiqm_volume_TooOldSnapshot | Volume Too Old Snapshot | Days | Specifies the age of a Snapshot copy, which, if exceeded, is considered too old for the volume |
| netapp_aiqm_volume_QuotaToalFilesUsed | Volume Quota Total Files Used | count | Total files used in Quota |
| netapp_aiqm_volume_QuotaSpaceHardLimit | Volume Quota Space HardLimt | Bytes | Quota Space hard limit in GB |
| netapp_aiqm_volume_QuotaSpaceHardLimitPercentageUsed | Volume Quota Space HardLimt Utilization | % | Total space used as a percentage of space hard limit |
| netapp_aiqm_volume_QuotaToalSpaceUsed | Volume Quota Space Used | GB | Total space used by Quota |
| netapp_aiqm_volume_SpaceFullThresholdPercent | Volume SpaceFull Threshold Percent | Volume SpaceFull Threshold Percentage | |
| netapp_aiqm_lun_SizeTotal | Lun Total Size | GB | The total storage capacity of the LUN, in gigabytes. |
| netapp_aiqm_lun_SizeUsed | Lun Used Size | GB | The amount of space consumed by the main data stream of the LUN |
| netapp_aiqm_lun_SizeAvailable | Lun Available Size | GB | The amount of space available after the space consumed by the main data stream of the LUN |
| netapp_aiqm_lun_PercentageSizeUsed | Lun Utilization | % | Lun Utilization |
| netapp_aiqm_lun_Status | Lun Status | Returns status of Lun.Possible states are foreign_lun_error(0), nvfail(1), offline(2), online(3) and space_error(4) | |
| netapp_aiqm_lun_Latency | Lun Latency | microsec | The average response time for all I/O requests, expressed in microseconds per operation. |
| netapp_aiqm_lun_Iops | Lun Iops | Req per Sec | Number of input/output operations per second on the Lun |
| netapp_aiqm_lun_Throughput | Lun ThroughPut | Mbps | The throughput on the LUN, measured in bytes per second |
| netapp_aiqm_qtree_ReadOps | Qtree Read Ops | s | Number of read input/output operations per second on the qtree |
| netapp_aiqm_qtree_WriteOps | Qtree Write Ops | s | Number of write input/output operations performed per second on qtree |
| netapp_aiqm_qtree_OtherOps | Qtree Other Ops | s | Number of other operations performed. Other I/O operations can be metadata operations, such as directory lookups and so on |
| netapp_aiqm_qtree_TotalOps | Qtree Total Ops | s | Performance metric aggregated over all types of I/O operations |
| netapp_aiqm_qtree_Status | Qtree Status | Returns status of Qtree. Possible states are ok(0), error(1), partial_no_data(2), partial_no_uuid(3), partial_no_response(4), partial_other_error(5),negative_delta(6), backfilled_data(7), inconsistent_delta_time(8), inconsistent_old_data(9) | |
| netapp_aiqm_port_Speed | Storage Port Speed | Gbps | Cluster Storage Port Speed |
| netapp_aiqm_port_Status | Storage Port Status | Storage Port Status, Possible status are error(0), online(1) and offline(2) | |
| netapp_aiqm_shelf_Status | Shelf Status | Returns the status of the Shelf. Possible states are unknown(0), error(1) and ok(2) | |
| netapp_aiqm_shelf_PortStatus | Shelf Port Status | Returns the status of the Ports associated with the shelf. Possible states are disconnected(0), error(1) and connected(2) |
Risks and Limitations
- Application can handle Critical/Recovery failure notifications for below two cases when user enables App Failure Notifications in configuration
- Connectivity Exception
- Authentication Exception
- Application will not send any duplicate/repeat failure alert notification until the already existing critical alert is recovered.
- Using metrics for monitoring the resources and generating alerts when the threshold values are breached.
- Application cannnot control monitoring pause/resume actions based on above alerts
- NetApp Active Iq Unified Manager Event/AlertPolling will be started only if the user enables App Failure Notifications in configuration.
- Possible values of Alert Severity Filter configuration property are warning, critical and error.
- OpsRamp has given sample mappings to map NetApp Active Iq Unified Manager Severity with OpsRamp Severities as part of the Event/Alert Severity Mapping configuration file.