| Supported Versions |
|---|
| Pacemaker : Pacemaker 1.1.23-1.el7_9.1 |
| Non-PaceMaker : RGManager - 6.5 ( Linux nodes : redhat-6.2.0) |
Introduction
Linux cluster is a group of Linux computers or nodes, storage devices that work together and are managed as a single system. A traditional clustering configuration has two nodes that are connected to shared storage (typically a SAN). With Linux clustering, an application is run on one node, and clustering software is used to monitor its operation.
A Linux cluster provides faster processing speed, larger storage capacity, better data integrity, greater reliability and wider availability of resources.
Failover
Failover is a process. Whenever a primary system, network or a database fails or is abnormally terminated, then a Failover acts as a standby which helps resume these operations.
Failover Cluster
Failover cluster is a set of servers that work together to provide High Availability (HA) or Continuous availability (CA). As mentioned earlier, if one of the servers goes down another node in the cluster can take over its workload with minimal or no downtime. Some failover clusters use physical servers whereas others involve virtual machines (VMs).
CA clusters allow users to access and work on the services and applications without any incidence of timeouts (100% availability), in case of a server failure. HA clusters, on the other hand, may cause a short hiatus in the service, but system recovers automatically with minimum downtime and no data loss.
A cluster is a set of two or more nodes (servers) that transmit data for processing through cables or a dedicated secure network. Even load balancing, storage or concurrent/parallel processing is possible through other clustering technologies.
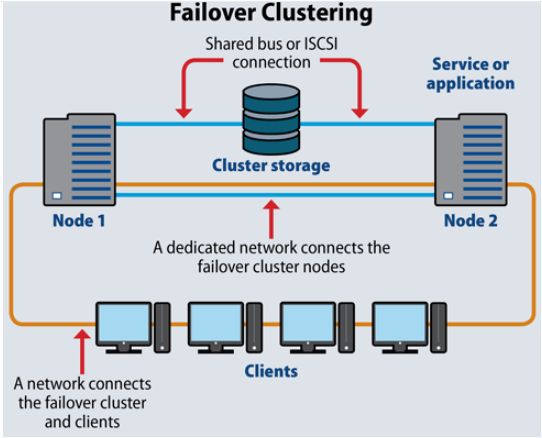
If you look at the above image, Node 1 and Node 2 have common shared storage. Whenever one node goes down, the other one will pick up from there. These two nodes have one virtual IP that all other clients connect to.
Let us take a look at the two failover clusters, namely High Availability Failover Clusters and Continuous Availability Failover Clusters.
High Availability Failover Clusters
In case of High Availability Failover Clusters, a set of servers share data and resources in the system. All the nodes have access to the shared storage.
High Availability Clusters also include a monitoring connection that servers use to check the “heartbeat” or health of the other servers. At any time, at least one of the nodes in a cluster is active, while at least one is passive.
Continuous Availability Failover Clusters
This system consists of multiple systems that share a single copy of a computer’s operating system. Software commands issued by one system are also executed on the other systems. In case of a failover, the user can check critical data in a transaction.
There are a few Failover Cluster types like Linux Server Failover Cluster (WSFC), VMware Failover Clusters, SQL Server Failover Clusters, and Red Hat Linux Failover Clusters.
Hierarchy of Linux Cluster
Cluster
-Nodes
Pre-Requisites
- The OpsRamp Gateway must be installed.
- Pre-requisites for Pacemaker:
- Credentials: root / non-root privileges with a member of “haclient” group.
- Cluster management: Pacemaker
- Accessibility: All nodes within a cluster should be accessible by a single credential set.
- For non-root users: Update “~/.bashrc” file with “pcs” command path across all cluster nodes.
Ex: export PATH=$PATH:/usr/sbin -> as a new line in ~/.bashrc file.
- Pre-requisites for RGManager(non-pacemaker):
Credentials: should provide access to both root and non-root users.
Cluster management: RGManager
Accessibility: All the nodes within a cluster should be accessible by a single credential set.
For non-root users: Update the following commands in “etc/sudoers” file to provide access for non-root users to execute these commands.
“/usr/sbin/cman_tool nodes,/usr/sbin/cman_tool status,/usr/sbin/clustat -l,/sbin/service cman status,/sbin/service rgmanager status,/sbin/service corosync status,/usr/sbin/dmidecode -s system-uuid,/bin/cat /sys/class/dmi/id/product_serial”
Note: Usually a linux cluster will be configured with a virtual-ip normally called as cluster-virtual-ip.We use this Ip for adding configurations during the installation of integration.If the cluster-virtual-ip is not configured give the ip address of the reachable node associated with the cluster.
Configure and install the integration
- Go to Setup > Integrations and Apps.
- Click + ADD on the INSTALLED APP page. The ADD APP page displays all the available applications along with the newly created application with the version.
Notes:- If there are already installed applications, it will redirect to the INSTALLED APPS page, where all the installed applications are displayed.
- If there are no installed applications, it will navigate to the ADD APP page.
- You can even search for the application using the search option available. Also you can use the All Categories option to search.
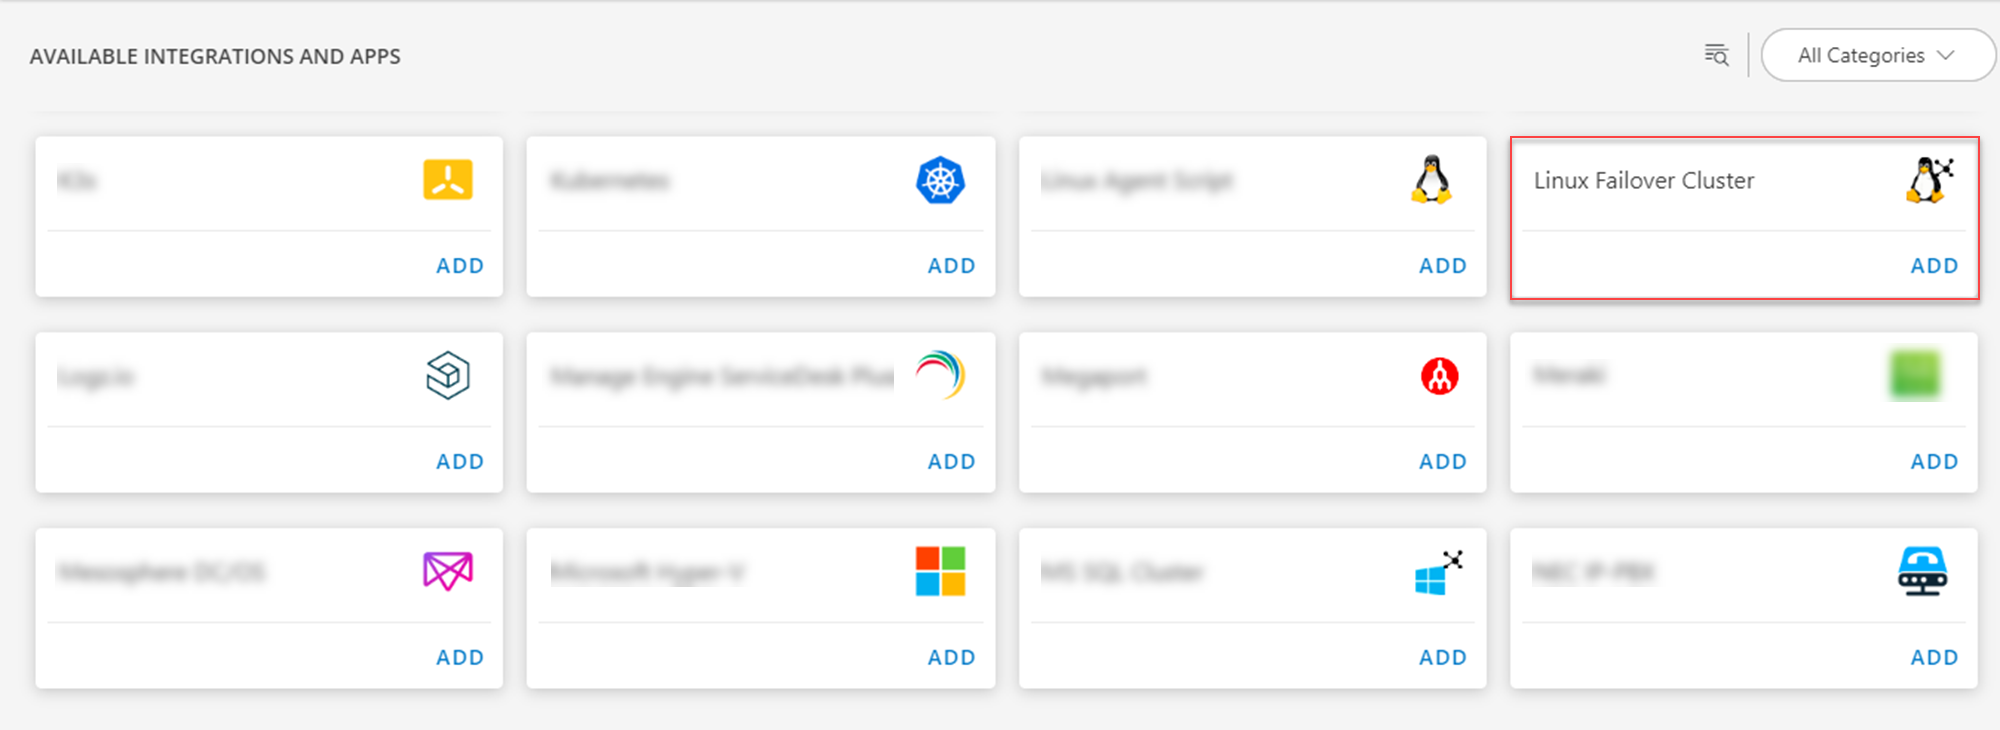
- Click ADD in the Linux Failover Cluster application.
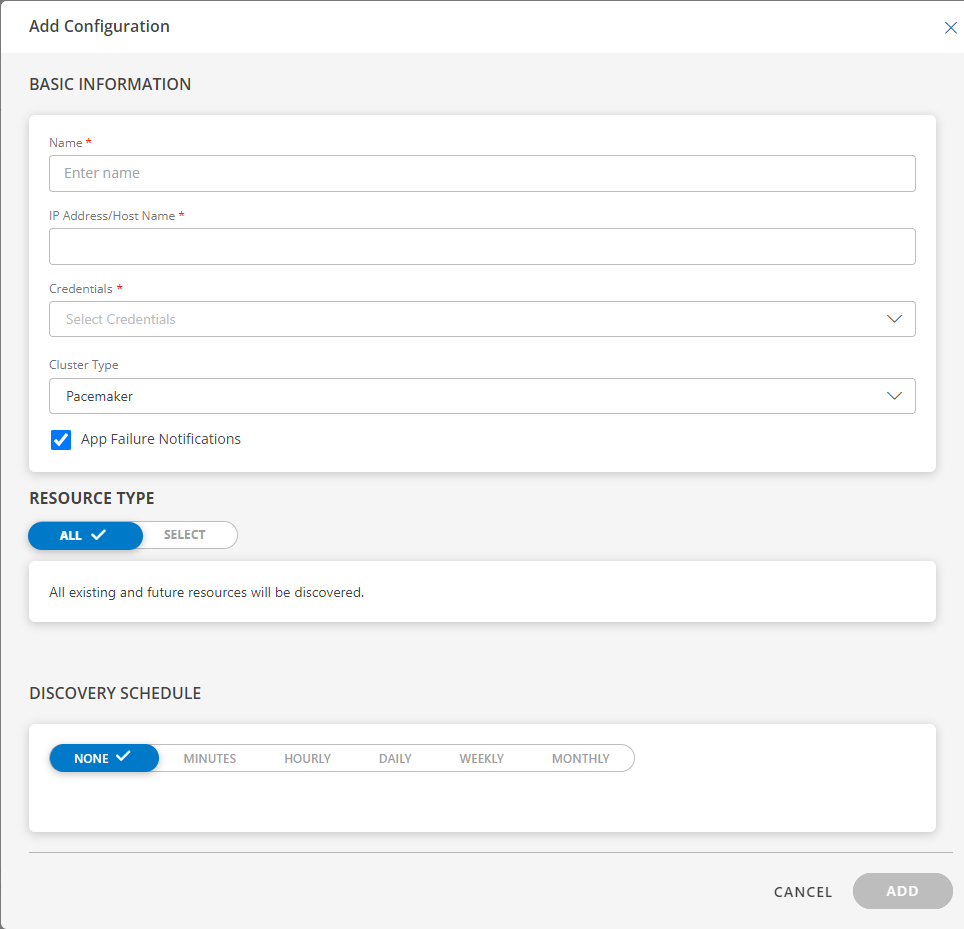
- In the Configurations page, click + ADD. The Add Configuration page appears.
- Enter the below mentioned BASIC INFORMATION:
| Object Name | Description |
|---|---|
| Name | Enter the name for the integration |
| IP Address/Host Name | IP address/host name of the target. |
| Credentials | Select the credentials from the drop-down list. Note: Click + Add to create a credential. |
| Cluster Type | Select Pacemake or RGManager from the Cluster Type drop-down list. |
Note: Select App Failure Notifications to be notified in case of an application failure that is, Connectivity Exception, Authentication Exception.
- In the RESOURCE TYPE section, select:
- ALL: All the existing and future resources will be discovered.
- SELECT: You can select one or multiple resources to be discovered.
- In the DISCOVERY SCHEDULE section, select Recurrence Pattern to add one of the following patterns:
- Minutes
- Hourly
- Daily
- Weekly
- Monthly
- Click ADD.
- Now the configuration is saved and displayed on the configurations page after you save it.
Note: From the same page, you may Edit and Remove the created configuration. - Click NEXT
- In the Installation page, select an existing registered gateway profile, and click FINISH.
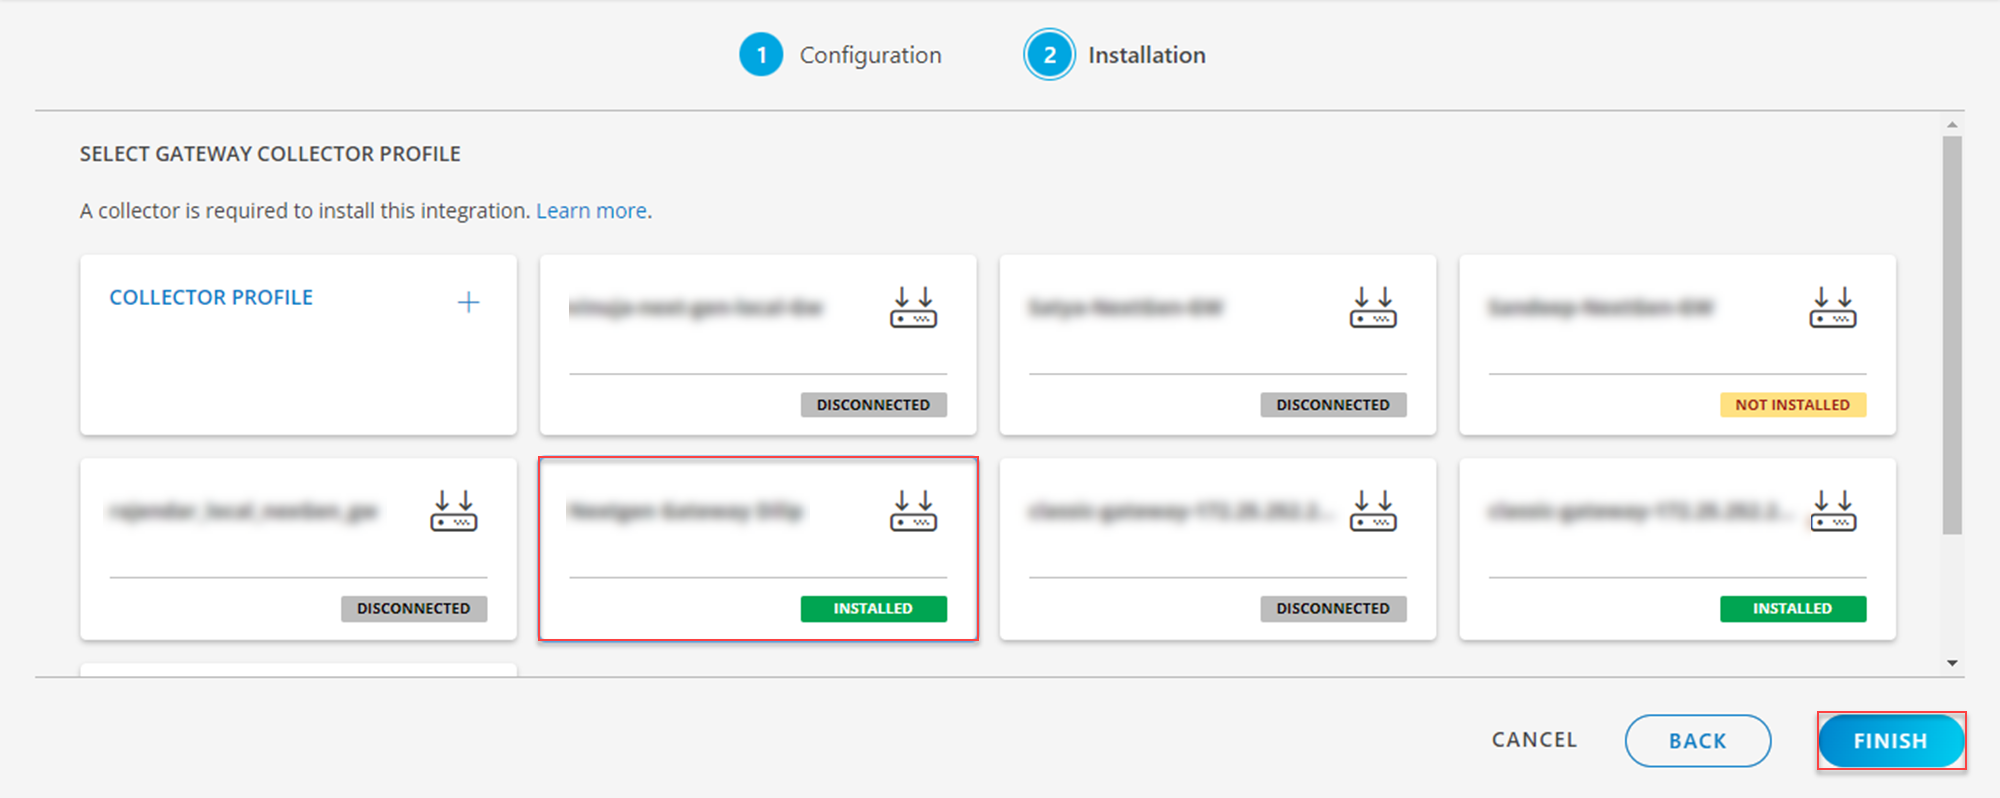
The application is now installed and displayed on the Installed Integrations page. Use the search field to find the installed application.
Modify the Configuration
See Modify an Installed Integration or Application article.
Note: Select the Linux Failover Cluster application.
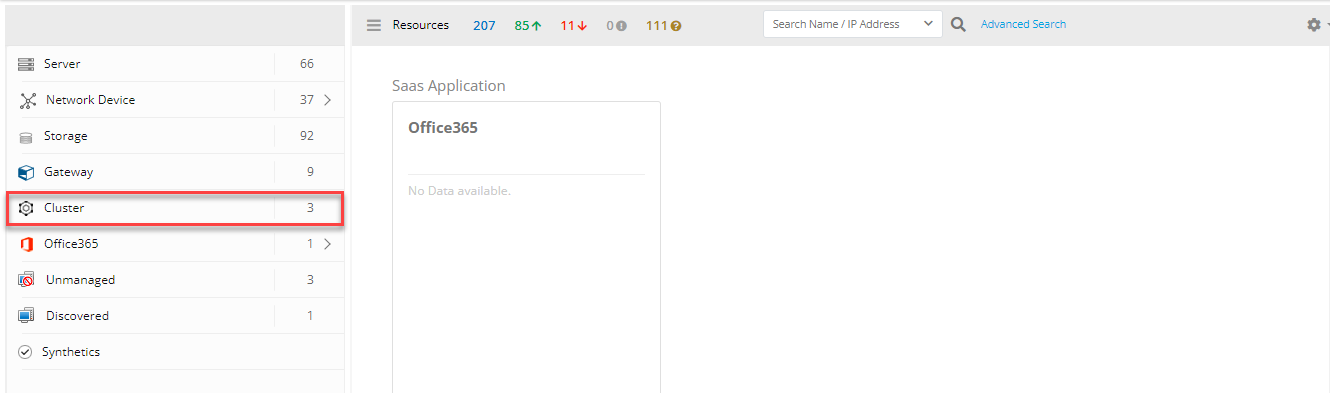
View the Linux Failover Cluster details
To view the resource information, go to Infrastructure > Resources > Cluster and click on your created cluster name. You can navigate to the Attributes tab to view the discovery details, and Metrics tab to view the metric details for Linux Failover Cluster.
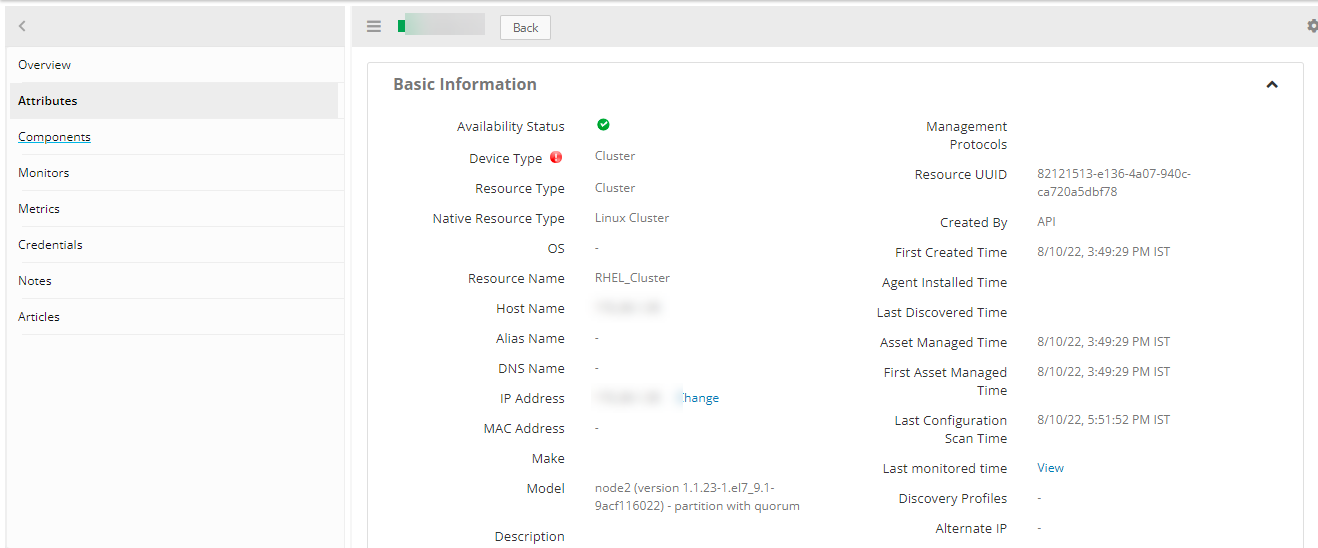
View resource attributes
The discovered resource(s) are displayed under Attributes. In this page you will get the basic information about the resources such as: Resource Type, Native Resource Type, Resource Name, IP Address etc.
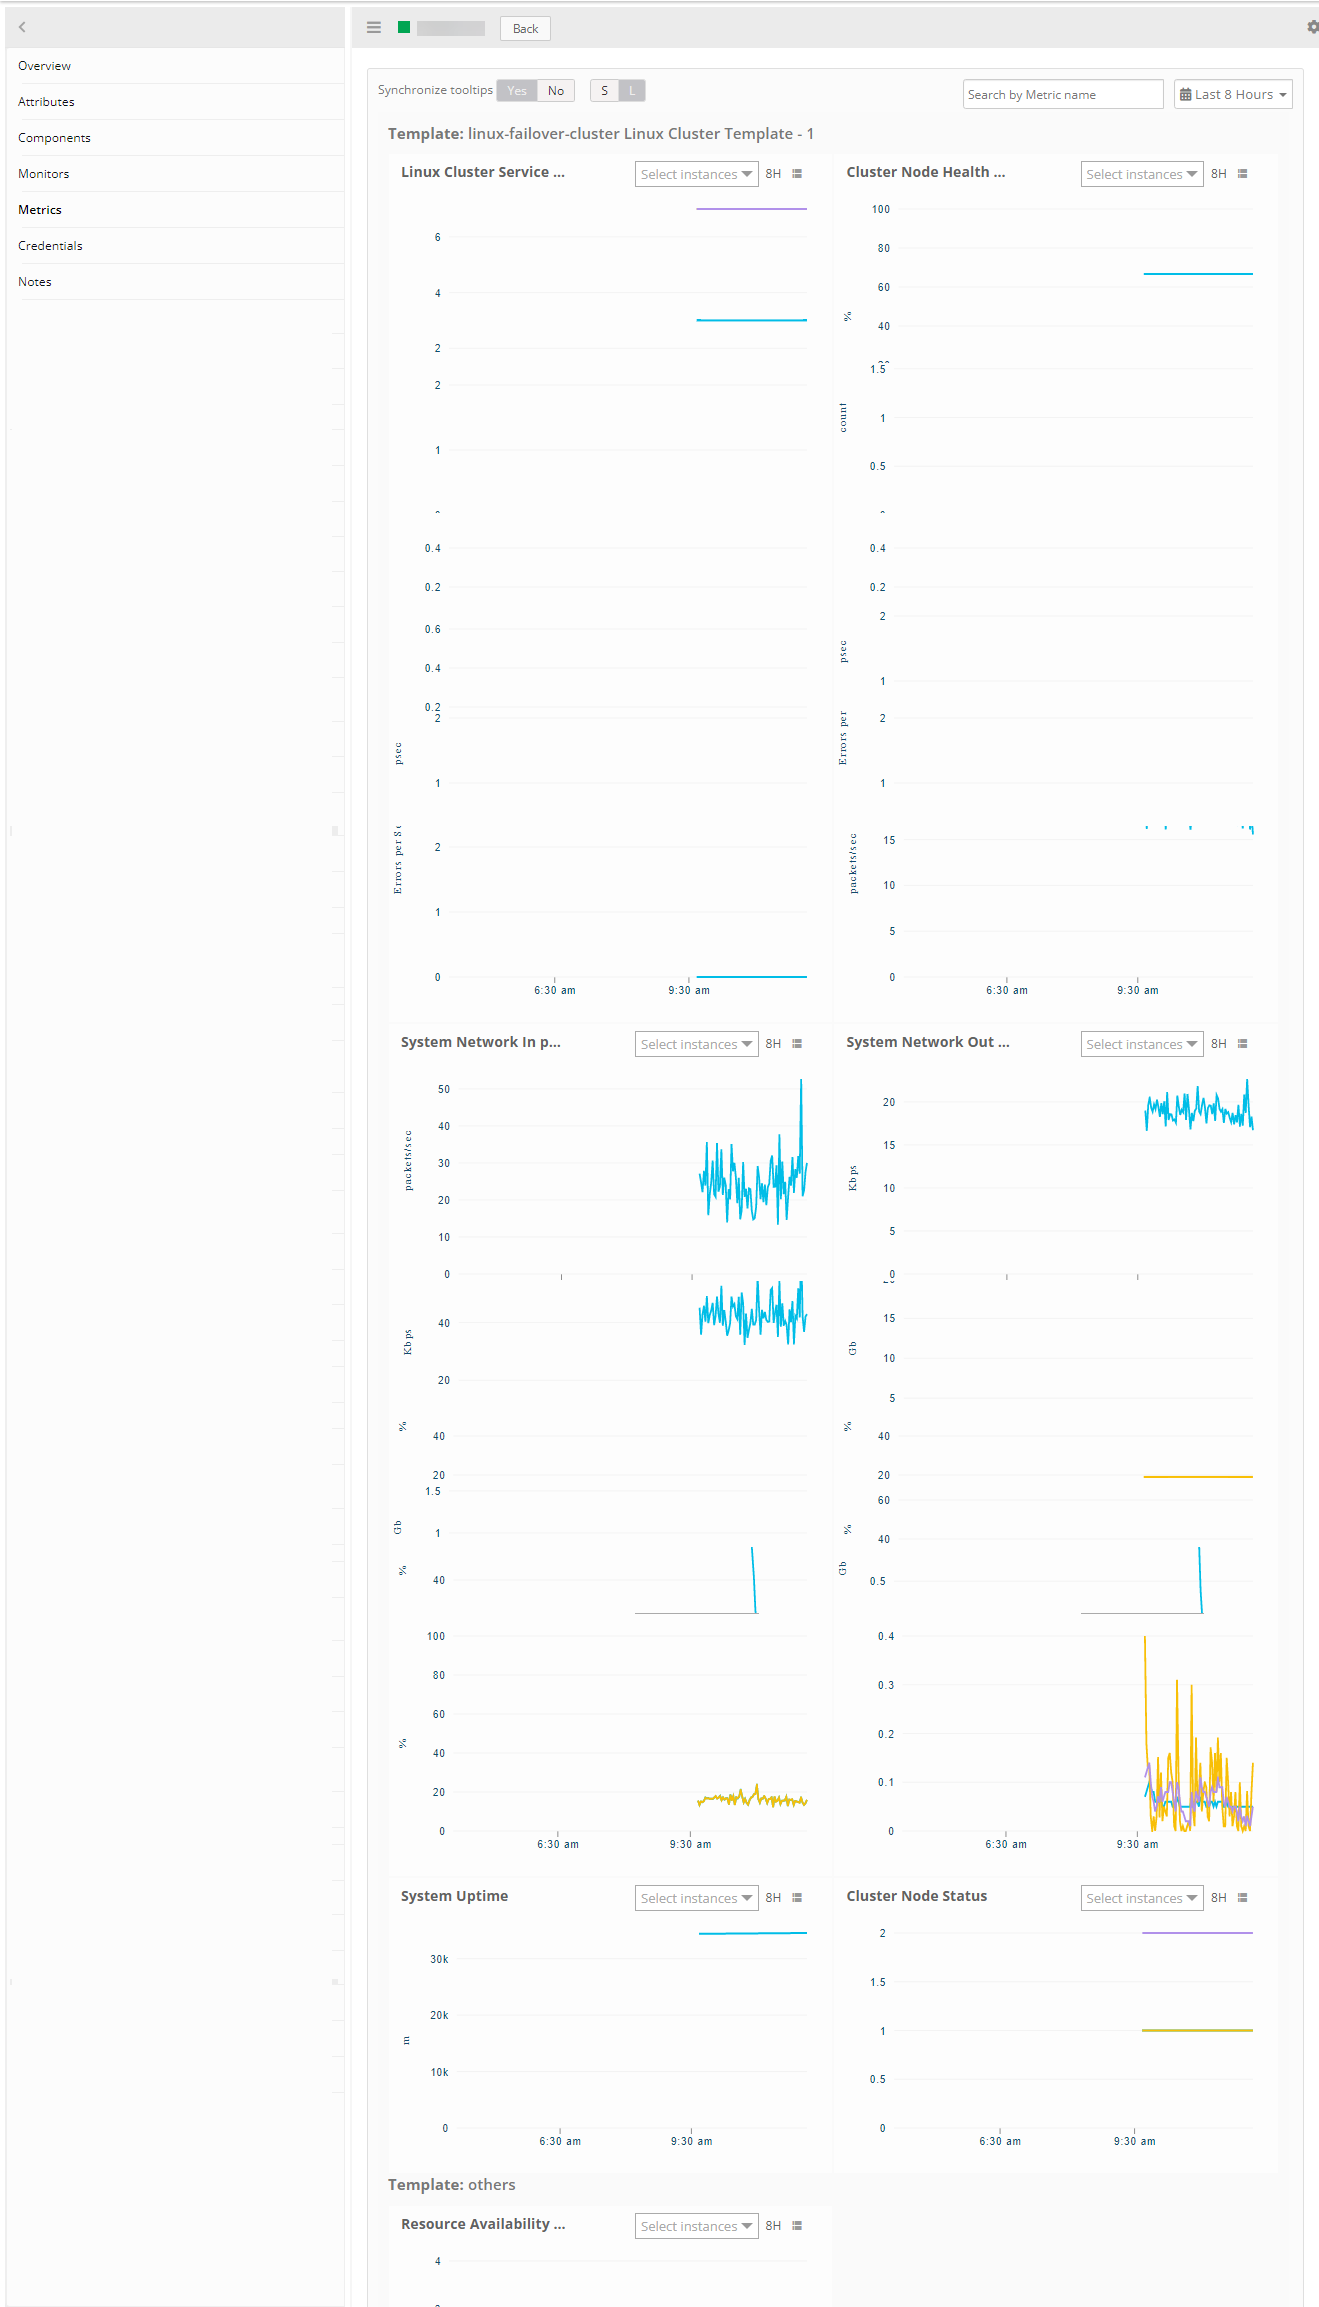
View resource metrics
To confirm Linux Cluster monitoring, review the following:
- Metric graphs: A graph is plotted for each metric that is enabled in the configuration.
- Alerts: Alerts are generated for metrics that are configured as defined for integration.
Supported Metrics
Resource Type: Cluster
Pacemaker
| Metric Names | Description | Display Name | Unit | Pacemaker / RGManager |
|---|---|---|---|---|
| linux_cluster_nodes_status | Status of each nodes present in linux cluster. 0 - offline, 1- online, 2- standby | Cluster Node Status | Both | |
| linux_cluster_system_OS_Uptime | Time lapsed since last reboot in minutes | System Uptime | m | Both |
| linux_cluster_system_cpu_Load | Monitors the system's last 1min, 5min and 15min load. It sends per cpu core load average. | System CPU Load | Both | |
| linux_cluster_system_cpu_Utilization | The percentage of elapsed time that the processor spends to execute a non-Idle thread(This doesn't includes CPU steal time) | System CPU Utilization | % | Both |
| linux_cluster_system_memory_Usedspace | Physical and virtual memory usage in GB | System Memory Used Space | Gb | Both |
| linux_cluster_system_memory_Utilization | Physical and virtual memory usage in percentage. | System Memory Utilization | % | Both |
| linux_cluster_system_cpu_Usage_Stats | Monitors cpu time in percentage spent in various program spaces. User - The processor time spent running user space processes System - The amount of time that the CPU spent running the kernel. IOWait - The time the CPU spends idle while waiting for an I/O operation to complete Idle - The time the processor spends idle Steal - The time virtual CPU has spent waiting for the hypervisor to service another virtual CPU running on a different virtual machine. Kernal Time Total Time | System CPU Usage Statistics | % | Both |
| linux_cluster_system_disk_Usedspace | Monitors disk used space in GB | System Disk UsedSpace | Gb | Both |
| linux_cluster_system_disk_Utilization | Monitors disk utilization in percentage | System Disk Utilization | % | Both |
| linux_cluster_system_disk_Inode_Utilization | This monitor is to collect DISK Inode metrics for all physical disks in a server. | System Disk Inode Utilization | % | Both |
| linux_cluster_system_disk_freespace | Monitors the Free Space usage in GB | System FreeDisk Usage | Gb | Both |
| linux_cluster_system_network_interface_Traffic_In | Monitors In traffic of each interface for Linux Devices | System Network In Traffic | Kbps | Both |
| linux_cluster_system_network_interface_Traffic_Out | Monitors Out traffic of each interface for Linux Devices | System Network Out Traffic | Kbps | Both |
| linux_cluster_system_network_interface_Packets_In | Monitors in Packets of each interface for Linux Devices | System Network In packets | packets/sec | Both |
| linux_cluster_system_network_interface_Packets_Out | Monitors Out packets of each interface for Linux Devices | System Network out packets | Both | |
| linux_cluster_system_network_interface_Errors_In | Monitors network in errors of each interface for Linux Devices | System Network In Errors | Errors per Sec | Both |
| linux_cluster_system_network_interface_Errors_Out | Monitors Network Out traffic of each interface for Linux Devices | System Network Out Errors | Errors per Sec | Both |
| linux_cluster_system_network_interface_discards_In | Monitors Network in discards of each interface for Linux Devices | System Network In discards | psec | Both |
| linux_cluster_system_network_interface_discards_Out | Monitors network Out Discards of each interface for Linux Devices | System Network Out discards | psec | Both |
| linux_cluster_service_status_Pacemaker | Pacemaker High Availability Cluster Manager. The status representation as follows : 0 - "failed", 1 - "active" & 2 - "unknown" | Pacemaker Service Status | Pacemaker | |
| linux_cluster_service_status_Corosync | The Corosync Cluster Engine is a Group Communication System. The status representation as follows : 0 - "failed", 1 - "active" & 2 - "unknown" | Corosync Service Status | Pacemaker | |
| linux_cluster_service_status_PCSD | PCS GUI and remote configuration interface. The status representation as follows : 0 - "failed", 1 - "active" & 2 - "unknown" | PCSD Service Status | Pacemaker | |
| linux_cluster_Online_Nodes_Count | Online cluster nodes count | Online Nodes Count | count | Both |
| linux_cluster_Failover_Status | Provides the details about cluster failover status. The integer representation as follows , 0 - cluster is running on the same node , 1 - there is failover happened | Cluster FailOver Status | Both | |
| linux_cluster_node_Health | This metrics gives the info about the percentage of online linux nodes available within a cluster. | Cluster Node Health Percentage | % | Both |
| linux_cluster_service_Status | Cluster Services Status. The status representation as follows : 0 - disabled, 1-blocked, 2 - failed, 3 - stopped, 4 - recovering, 5 - stopping, 6 - starting, 7 - started, 8 - unknown | Linux Cluster Service Status | Both | |
| linux_cluster_service_status_rgmanager | RGManager Service Status. The status representation as follows : 0 - \"failed\", 1 - \"active\" , 2 - \"unknown\" | RGManager Service Status | RGManager | |
| linux_cluster_service_status_CMAN | CMAN Service Status. The status representation as follows : 0 - \"failed\", 1 - \"active\" \u0026 2 - \"unknown\" | CMAN Service Status | RGManager |
Resource Type: Server
| Metric Names | Description | Display Name | Unit | Pacemaker / RGManager |
|---|---|---|---|---|
| linux_node_system_OS_Uptime | Time lapsed since last reboot in minutes | System Uptime | m | Both |
| linux_node_system_cpu_Load | Monitors the system's last 1min, 5min and 15min load. It sends per cpu core load average. | System CPU Load | Both | |
| linux_node_system_cpu_Utilization | The percentage of elapsed time that the processor spends to execute a non-Idle thread(This doesn't includes CPU steal time) | System CPU Utilization | % | Both |
| linux_node_system_memory_Usedspace | Physical and virtual memory usage in GB | System Memory Used Space | Gb | Both |
| linux_node_system_memory_Utilization | Physical and virtual memory usage in percentage. | System Memory Utilization | % | Both |
| linux_node_system_cpu_Usage_Stats | Monitors cpu time in percentage spent in various program spaces. User - The processor time spent running user space processes System - The amount of time that the CPU spent running the kernel. IOWait - The time the CPU spends idle while waiting for an I/O operation to complete Idle - The time the processor spends idle Steal - The time virtual CPU has spent waiting for the hypervisor to service another virtual CPU running on a different virtual machine. Kernal Time Total Time | System CPU Usage Statistics | % | Both |
| linux_node_system_disk_Usedspace | Monitors disk used space in GB | System Disk UsedSpace | Gb | Both |
| linux_node_system_disk_Utilization | Monitors disk utilization in percentage | System Disk Utilization | % | Both |
| linux_node_system_disk_Inode_Utilization | This monitor is to collect DISK Inode metrics for all physical disks in a server. | System Disk Inode Utilization | % | Both |
| linux_node_system_disk_freespace | Monitors the Free Space usage in GB | System FreeDisk Usage. | Gb | Both |
| linux_node_system_network_interface_Traffic_In | Monitors In traffic of each interface for Linux Devices | System Network In Traffic. | Kbps | Both |
| linux_node_system_network_interface_Traffic_Out | Monitors Out traffic of each interface for Linux Devices | System Network Out Traffic | Kbps | Both |
| linux_node_system_network_interface_Packets_In | Monitors in Packets of each interface for Linux Devices | System Network In packets | packets/sec | Both |
| linux_node_system_network_interface_Packets_Out | Monitors Out packets of each interface for Linux Devices | System Network out packets | packets/sec | Both |
| linux_node_system_network_interface_Errors_In | Monitors network in errors of each interface for Linux Devices | System Network In Errors | Errors per Sec | Both |
| linux_node_system_network_interface_Errors_Out | Monitors Network Out traffic of each interface for Linux Devices | System Network Out Errors | Errors per Sec | Both |
| linux_node_system_network_interface_discards_In | Monitors Network in discards of each interface for Linux Devices | System Network In discards | psec | Both |
| linux_node_system_network_interface_discards_Out | Monitors network Out Discards of each interface for Linux Devices | System Network Out discards | psec | Both |
Risks, Limitations & Assumptions
- Application can handle Critical/Recovery failure notifications for below two cases when user enables App Failure Notifications in configuration
- Connectivity Exception
- Authentication Exception
- Application will not send any duplicate/repeat failure alert notification until the already existing critical alert is recovered.
- Metrics can be used to monitor Linux-Failover-Cluster resources and can generate alerts based on the threshold values.
- No support of showing activity log and applied time.
- No support for the option to get Latest snapshot metric.