| Supported Versions |
|---|
| Minimum Support Version: Oracle weblogic 12c |
Introduction
WebLogic Server allows you to quickly develop and deploy reliable, secure, scalable and manageable applications. It manages system-level details so you can concentrate on business logic and presentation.
WebLogic domain is a fundamental administrative unit for WebLogic Server. It comprises one or more WebLogic Server instances with their resources, which are collectively managed and configured using a single Administration Server.
The WebLogic domain infrastructure consists of three parts:
- Administration Server: Guides the actions of managed servers.
- Managed Servers: Stand-alone servers ruled by the Administration Server.
- Clusters: Clusters are groups of managed servers managed by the Administration Server.
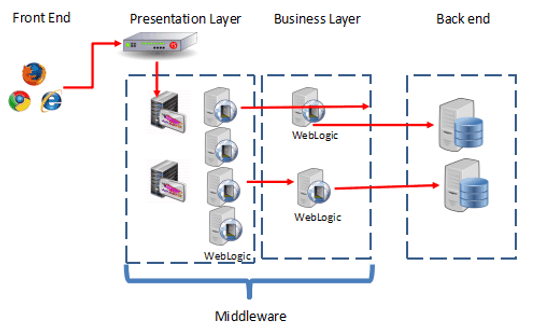
WebLogic Server Domains are referred to as Managed Servers, in which Java Enterprise Solutions are deployed. These Managed Servers are grouped into clusters for load balancing and failover, especially for critical applications. Multiple WebLogic domains are also set up according to application boundaries, system administrator responsibilities and server’s geographical location. Alternatively you can set up a single domain to manage all WebLogic Server administration activities.
The most common WebLogic Server user types are:
- Evaluator: Users who performs product evaluations
- Installer: Users who installs and sets up the WebLogic Server environment
- System Administrator: Users who administers WebLogic Server after it is installed
- Developer/Engineer: Users who develop applications to run in the WebLogic Server environment.
Prerequisites
- The OpsRamp Gateway must be installed.
- To access Weblogic Enterprise Server Api’s the user should Enable RESTful Management Services in Weblogic Admin Console Configurations.
Key Use cases
Discovery Use cases
- It discovers the oracle weblogic application server components like weblogic domain, clusters, servers and its related applications and data sources. the following are the resource structure.
→ WebLogic Enterprise Server
→ WebLogic Clusters
→ WebLogic Servers
→ Weblogic Server Applications
→ WebLogic Server Datasources
- Publishes relationships between resources to have a topological view and ease of maintenance.
Configure and install the integration
- Go to Setup > Integrations and Apps.
- Click + ADD on the INSTALLED APP page. The ADD APP page displays all the available applications along with the newly created application with the version.
Notes:- If there are already installed applications, it will redirect to the INSTALLED APPS page, where all the installed applications are displayed.
- If there are no installed applications, it will navigate to the ADD APP page.
- You can even search for the application using the search option available. Also you can use the All Categories option to search.
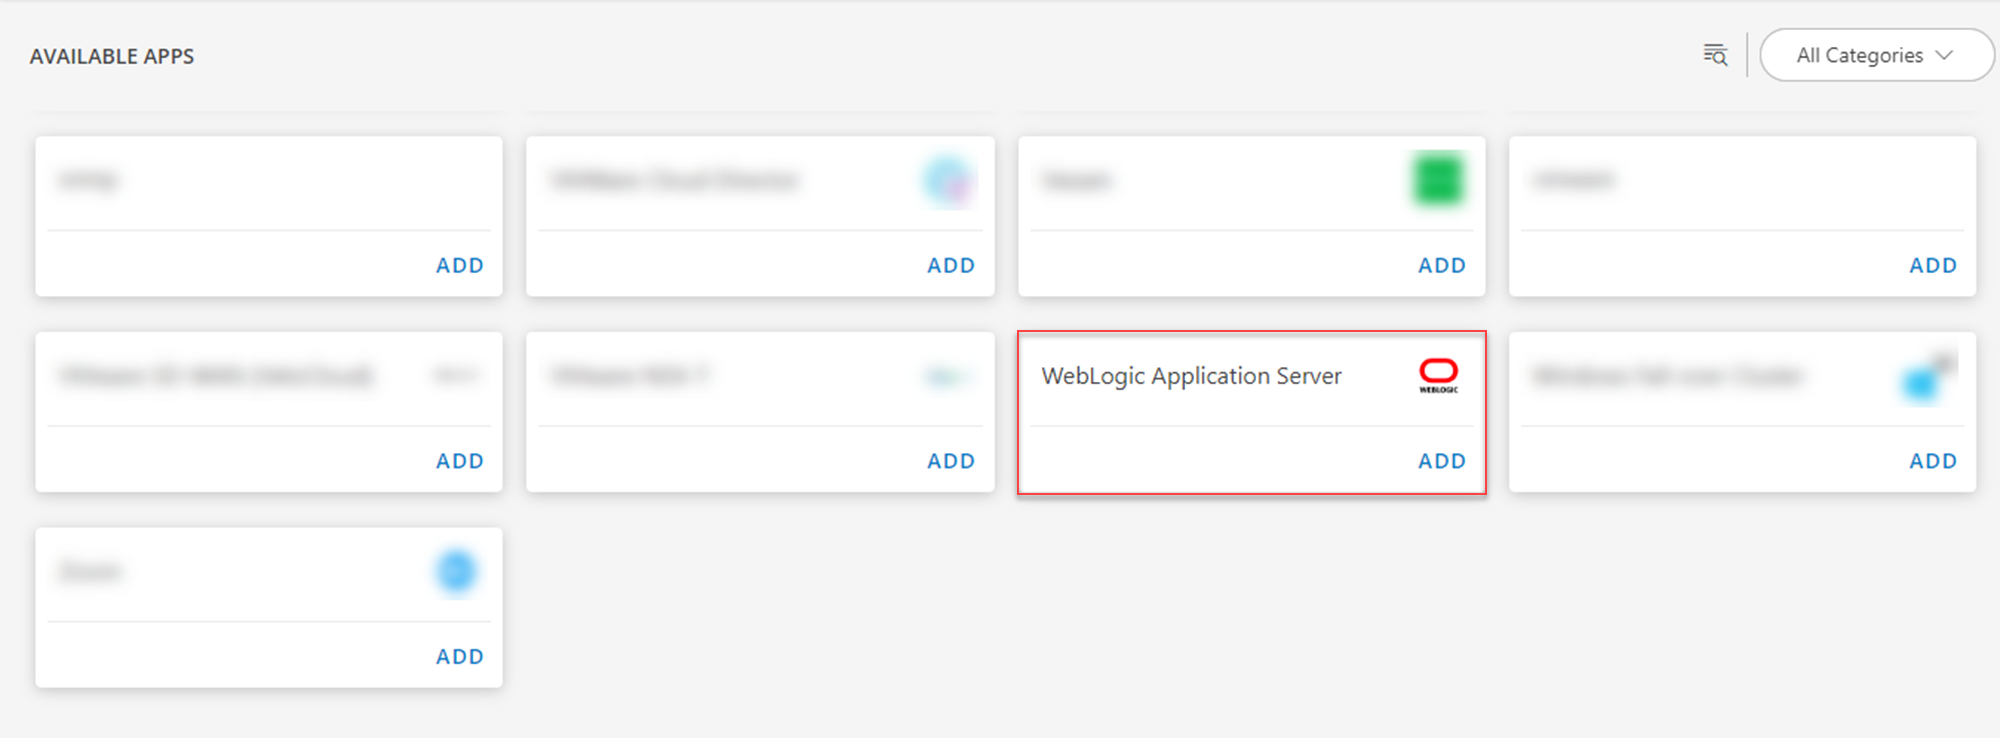
- Click ADD in the WebLogic Application Server application.
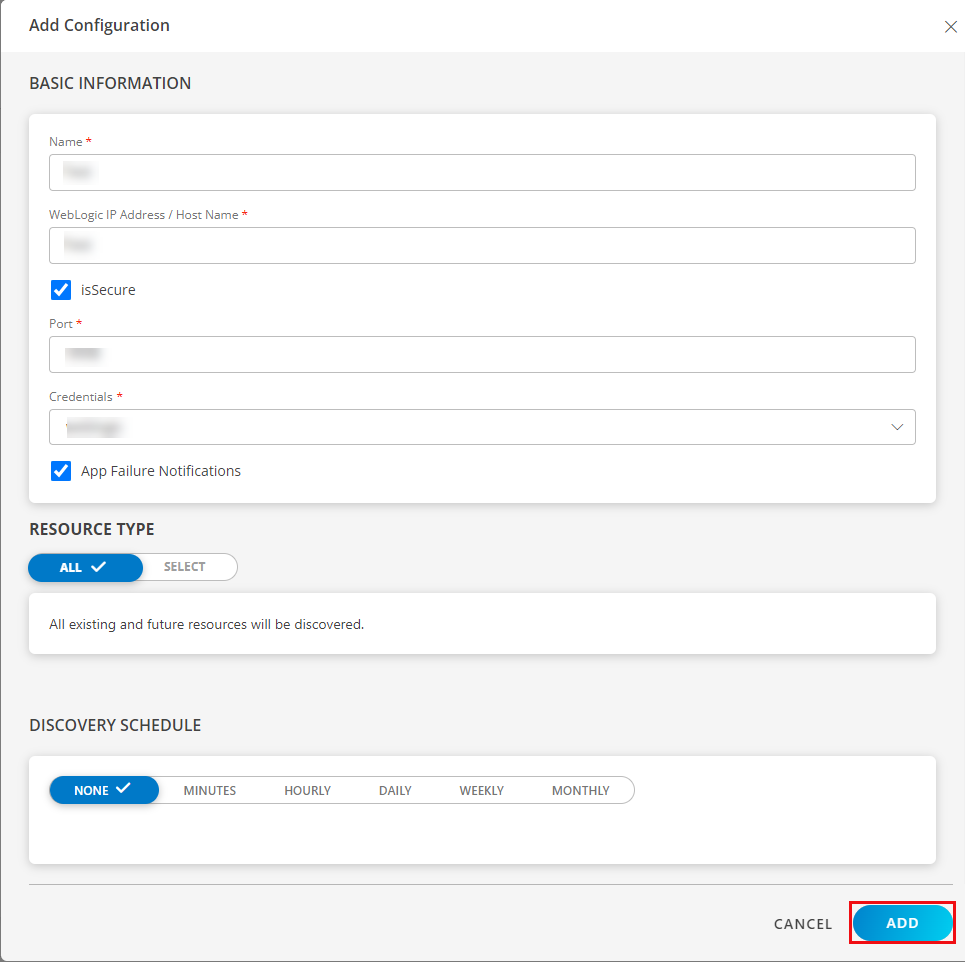
- In the Configurations page, click + ADD. The Add Configuration page appears.
- Enter the below mentioned BASIC INFORMATION:
| Functionality | Description |
|---|---|
| Name | Enter the name for the configuration. |
| WebLogic IP Address / Host Name | Provide the WebLogic IP Address / Host Name. |
| Port | Port Note: By default 7001 is added. |
| Credentials | Select the credentials from the drop-down list. Note: Click + Add to create a credential. |
Notes:
- By default the isSecure checkbox is selected.
- Select App Failure Notifications; if turned on, you will be notified in case of an application failure that is, Connectivity Exception, Authentication Exception.
- In the RESOURCE TYPE section, select:
- ALL: All the existing and future resources will be discovered.
- SELECT: You can select one or multiple resources to be discovered.
- In the DISCOVERY SCHEDULE section, select Recurrence Pattern to add one of the following patterns:
- Minutes
- Hourly
- Daily
- Weekly
- Monthly
- Click ADD.
- Now the configuration is saved and displayed on the configurations page after you save it.
Note: From the same page, you may Edit and Remove the created configuration. - Click NEXT
- In the Installation page, select an existing registered gateway profile, and click FINISH.
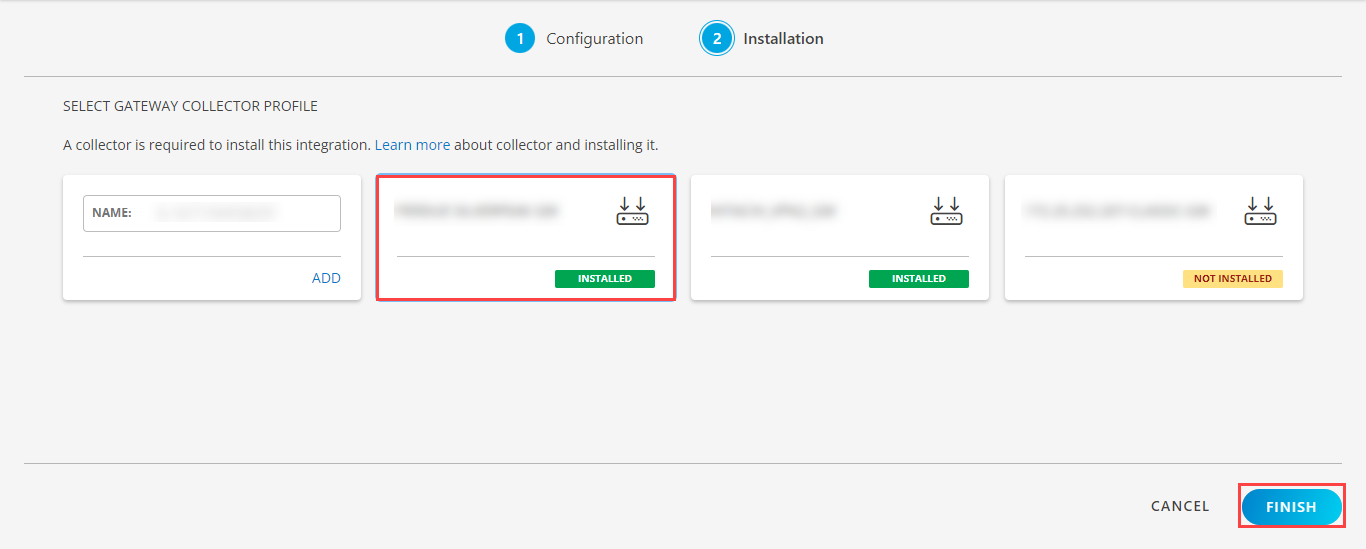
The application is now installed and displayed on the Installed Integration page. Use the search field to find the installed application.
Modify the Configuration
See Modify an Installed Integration or Application article.
Note: Select the WebLogic Application Server application.
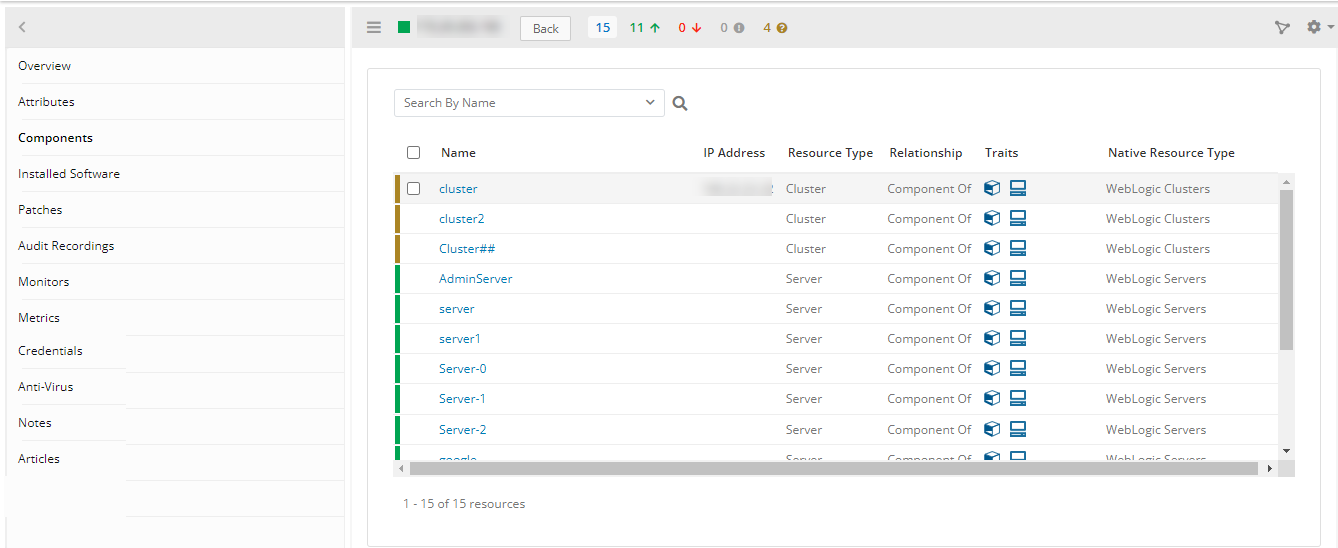
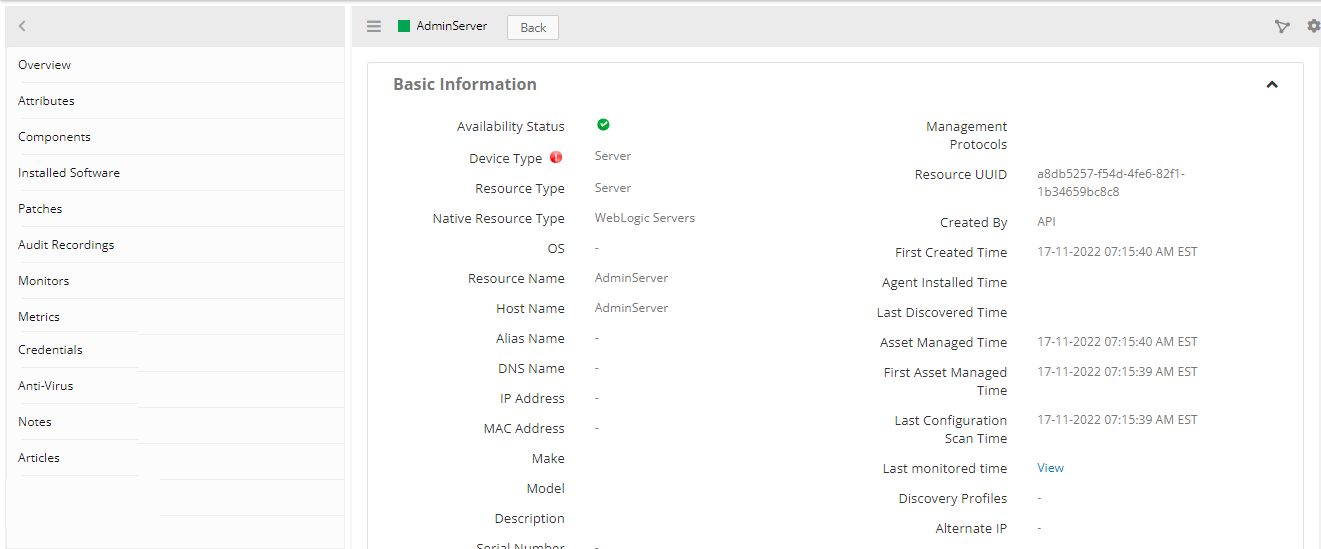
View the Weblogic Server details
The Weblogic Server integration is displayed in the Infrastructure > Resources > Server, select the relationship. You can navigate to the Attributes tab to view the discovery details, and the Metrics tab to view the metric details for Weblogic Server.
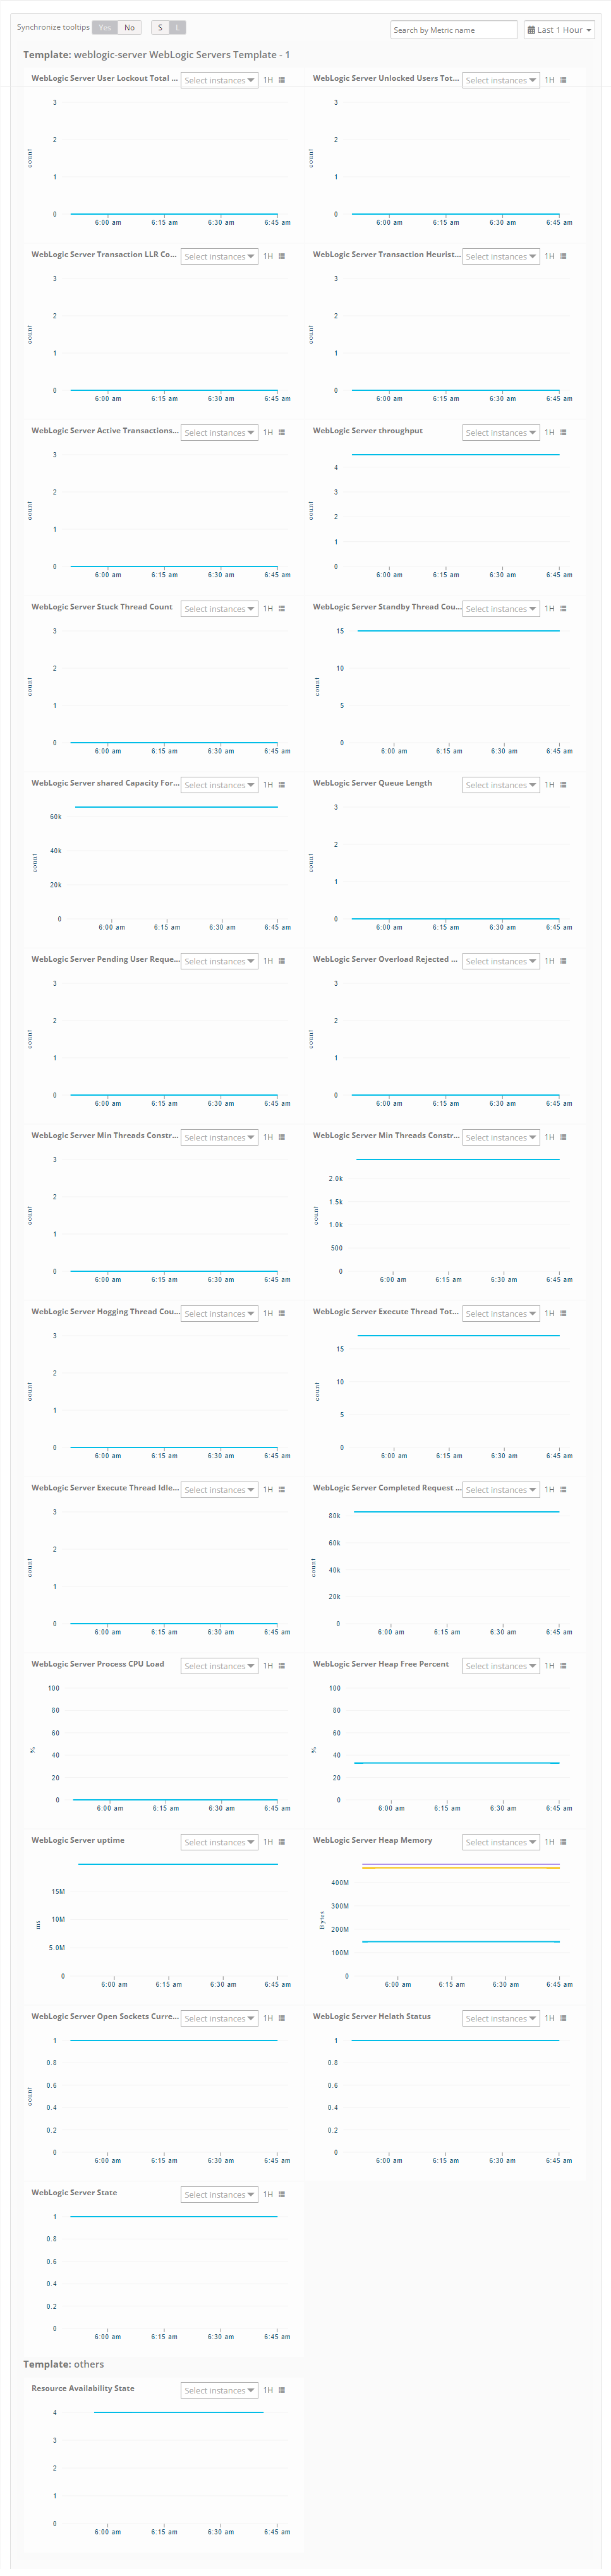
Supported metrics
| Native Resource Type | Metric Name | Metric Display Name | Units | Description |
|---|---|---|---|---|
| WebLogic Server Datasources | weblogic_server_datasource_activeConnectionsAverageCount | Active Connections Average Count | count | Displays the average number of active connections in this instance of the data source. This value is only valid if the resource is configured to allow shrinking. |
| weblogic_server_datasource_activeConnectionsCurrentCount | Active Connections Current Count | count | Displays the number of connections currently in use by applications. | |
| weblogic_server_datasource_connectionDelayTime | Connection Delay Time (ms) | ms | Displays the average amount of time, in milliseconds, that it takes to create a physical connection to the database. | |
| weblogic_server_datasource_connectionsTotalCount | Connections Total Count | count | Displays the cumulative total number of database connections created in this data source since the data source was deployed. | |
| weblogic_server_datasource_currentConnectionPoolCapacity | currentConnectionPoolCapacity | count | Displays the current count of JDBC connections in the connection pool in the data source. | |
| weblogic_server_datasource_failedReserveRequestCount | Failed Reserve Request Count | count | Displays the cumulative, running count of requests for a connection from this data source that could not be fulfilled. | |
| weblogic_server_datasource_failuresToReconnectCount | Failures To Reconnect Count | count | Displays the number of times that the data source attempted to refresh a database connection and failed. Failures may occur when the database is unavailable or when the network connection to the database is interrupted. | |
| weblogic_server_datasource_leakedConnectionCount | Leaked Connection Count | count | Displays the number of leaked connections. A leaked connection is a connection that was reserved from the data source but was not returned to the data source by calling close(). | |
| weblogic_server_datasource_numberOfAvailableConnections | Num Available | count | Displays the number of database connections that are currently idle and available to be used by applications in this instance of the data source. | |
| weblogic_server_datasource_prepStmtCacheAccessCount | Prep Stmt Cache Access Count | count | Displays the number of prepared and callable statements currently cached in the statement cache. Each connection in the connection pool has its own cache of statements. This number is the sum of the number of statements in the caches for all connections in the connection pool. | |
| weblogic_server_datasource_waitingForConnectionCurrentCount | Waiting For Connection Current Count (Threads Waiting for connection) | count | Displays the number of connection requests waiting for a database connection. | |
| weblogic_server_datasource_activeConnectionsPercent | Active Connections in % | % | Displays the Active connections in Percentage. | |
| weblogic_server_datasource_connectionPoolUtilization | Connection pool utilization | % | Displays the connection pool utilization in percentage. | |
| WebLogic Server Applications | weblogic_server_application_state | State | N/A | Displays the WebLogic Server Application State and provides the possible application state values are STATE_ACTIVE (1),STATE_FAILED (0),STATE_NEW (2),STATE_RETIRED (3),STATE_PREPARED (4),STATE_ADMIN (5),STATE_UPDATE_PENDING (6) |
| weblogic_server_application_healthStatus | Health Status | N/A | Displays the Health status of the WebLogic Server Application and provides the possible application health status values are HEALTH_OK (1),UNKNOWN (0),HEALTH_WARN (2),HEALTH_CRITICAL (3),HEALTH_FAILED (4) and HEALTH_OVERLOADED (5) | |
| weblogic_server_application_openSessionsCurrentCount | Number of active sessions | count | Provides a count of the current total number of open sessions in this module. Returns the current total number of open sessions in this component. | |
| weblogic_server_application_openSessionsHighCount | Maximum number of sessions | count | Provides a count of the maximum number of sessions in this server. | |
| weblogic_server_application_sessionsOpenedTotalCount | Total number of sessions | count | Provides a count of the total number of sessions opened in this server. | |
| weblogic_server_application_numberOfServlets | Number of servlets | count | Provides the total number of servlets | |
| weblogic_server_application_executionAverageTime | Execution Time Average | ms | Displays the average amount of time all invocations of the servlet have executed since created. | |
| weblogic_server_application_invocationTotalCount | Invocation Total Count | count | Displays the total count of the times this servlet has been invoked. | |
| weblogic_server_application_averageResponseTime | Average Response Time | ms | Average response time of an application is calculated by dividing the number of active requests generated between two consecutive time intervals (the time when the agent collects the data from the server), by the time taken for processing these requests. | |
| weblogic_server_application_executionTimeTotal | Current Client Processing Time | ms | Amount of time taken to execute the servlet during the last interval. | |
| WebLogic Clusters | weblogic_server_cluster_weblogicPluginEnabled | weblogicPluginEnabled | N/A | Displays the weblogic server cluster plugin status, provides the possible weblogic plugin values are false (0) and true (1) |
| WebLogic Server | weblogic_server_state | weblogic_serverState | N/A | Displays the state of the WebLogic Server and provides the possible server state values RUNNING (1),SHUTDOWN (0),STARTING (2),STANDBY (3),ADMIN (4),RESUMING (5) and FAILED_NOT_RESTARTABLE (6) |
| weblogic_server_helathState | weblogic_serverHelathState | N/A | Displays the Health status of the WebLogic Server and provides the possible server health status values: HEALTH_OK (1),UNKNOWN (0),HEALTH_WARN (2),HEALTH_CRITICAL (3),HEALTH_FAILED (4) and HEALTH_OVERLOADED (5). | |
| weblogic_server_openSocketsCurrentCount | openSocketsCurrentCount | count | Displays the open sockets current count of the WebLogic Server. | |
| weblogic_server_heapMemory | JVM Runtime: Heap Free Current | Bytes | Displays the heap memory that is available in the JVM heap in bytes. | |
| weblogic_server_uptime | JVM Runtime: Uptime | ms | Displays the Server uptime value in milliseconds. | |
| weblogic_server_heapFreePercent | JVM Runtime: Heap Free Percent | % | Displays the percentage of the memory that is used. | |
| weblogic_server_processCpuLoad | Process cpu load | % | Displays the process cpu load. | |
| weblogic_server_completedRequestCount | Completed Request Count | count | Displays the number of completed requests in the priority queue. | |
| weblogic_server_executeThreadIdleCount | Execute Thread Idle Count | count | Displays the number of idle threads in the pool. This count does not include standby threads and stuck threads. The count indicates threads that are ready to pick up new work when it arrives. | |
| weblogic_server_executeThreadTotalCount | Execute Thread Total Count | count | Displays the total number of threads in the pool. | |
| weblogic_server_hoggingThreadCount | Hogging Thread Count | count | Displays the threads that are held by a request right now. These threads will either be declared as stuck after the configured timeout or will return to the pool. Note: The self-tuning mechanism will backfill if necessary. | |
| weblogic_server_minThreadsConstraintsCompleted | Min Threads Constraints Completed | count | Displays the number of requests with minimum threads constraint picked up from out of order for execution immediately, since their minimum threads requirement were not met. Note: This does not include the case where threads are idle during schedule. | |
| weblogic_server_minThreadsConstraintsPending | Min Threads Constraints Pending | count | Displays the number of requests that should be executed now to satisfy the minimum threads requirement. | |
| weblogic_server_overloadRejectedRequestsCount | Overload Rejected Requests Count | count | Displays the number of requests rejected due to configured Shared Capacity for work managers have been reached. | |
| weblogic_server_pendingUserRequestCount | Pending User Request Count | count | Displays the number of pending user requests in the priority queue. The priority queue contains requests from internal subsystems and users. This is just the count of all user requests. | |
| weblogic_server_queueLength | Queue Length | count | Displays the number of waiting requests in the queue. | |
| weblogic_server_sharedCapacityForWorkManagers | Shared Capacity For Work Managers | count | Displays the maximum amount of requests that can be accepted in the priority queue. Notes:
| |
| weblogic_server_standbyThreadCount | Standby Thread Count | count | Displays the number of threads in the standby pool. Threads that are not needed to handle the present workload are designated as standby and added to the standby pool. These threads are activated when more threads are needed. | |
| weblogic_server_stuckThreadCount | Stuck Thread Count | count | Displays the number of stuck threads in the thread pool. | |
| weblogic_server_throughput | Throughput | count | Displays the mean number of requests completed per second. | |
| weblogic_server_activeTransactionsTotalCount | Active Transactions Total Count | count | Displays the number of active transactions on the server. | |
| weblogic_server_transactionHeuristicsTotalCount | Transaction Heuristics Total Count | count | Displays the number of transactions that completed with a heuristic status since the server was started. | |
| weblogic_server_transactionLLRCommittedTotalCount | Transaction LLR Committed Total Count | count | Displays the total number of LLR transactions that were committed since the server was started. | |
| weblogic_server_transactionRolledBackTotalCount | Transaction Rolled Back App Total Count | count | Displays the number of transactions that were rolled back due to an application error. | |
| weblogic_server_transactionRolledBackResourceTotalCount | Transaction Rolled Back Resource Total Count | count | Displays the number of transactions that were rolled back due to a resource error. | |
| weblogic_server_transactionRolledBackSystemTotalCount | Transaction Rolled Back System Total Count | count | Displays the number of transactions that were rolled back due to an internal system error. | |
| weblogic_server_transactionRolledBackTimeoutTotalCount | Transaction Rolled Back Timeout Total Count | count | Displays the number of transactions that were rolled back due to a timeout expiration. | |
| weblogic_server_transactionTotalCount | Transaction Total Count | count | Displays the total number of transactions processed. This includes all committed, rolled back, and heuristic transaction completions since the server was started. | |
| weblogic_server_connectionsCurrentCount | Connections Current Count | count | Displays the number of current connections to the WebLogic Server. | |
| weblogic_server_connectionsHighCount | Connections High Count | count | Displays the highest number of connections to this WebLogic Server since the last reset. | |
| weblogic_server_connectionsTotalCount | Connections Total Count | count | Displays the total number of connections made to this WebLogic Server since the last reset. | |
| weblogic_server_JMSServersCurrentCount | JMS Servers Current Count | count | Displays the current number of JMS servers that are deployed on this WebLogic Server instance. | |
| weblogic_server_JMSServersHighCount | JMS Servers High Count | count | Displays the highest number of JMS servers that were deployed on this WebLogic Server instance since this server was started. | |
| weblogic_server_JMSServersTotalCount | JMS Servers Total Count | count | Displays the total number of JMS servers that were deployed on this WebLogic Server instance since this server was started. | |
| weblogic_server_invalidLoginAttemptsTotalCount | Server Security Runtime: Invalid Login Attempts | count | This monitor returns the total number of invalid logins that have been attempted on this server instance. | |
| weblogic_server_lockedUsersCurrentCount | Server Security Runtime: Current Locked Users | count | This monitor returns the current number of locked users on this server instance. | |
| weblogic_server_loginAttemptsWhileLockedTotalCount | Server Security Runtime: Login Attempts While Locked | count | This monitor returns the total number of invalid logins that have been attempted on this server instance while a user was locked. | |
| weblogic_server_unlockedUsersTotalCount | Server Security Runtime: Unlocked Users | count | This monitor returns the total number of times a user of this server instance has been unlocked. | |
| weblogic_server_userLockoutTotalCount | Server Security Runtime: User Lockout | count | This monitor returns the total number of user lockouts that have occurred on this server instance. |
Risks, Limitations & Assumptions
- Application can handle Critical/Recovery failure notifications for below two cases when user enables App Failure Notifications in configuration:
- Connectivity Exception
- Authentication Exception
- Application will not send any duplicate/repeat failure alert notification until the already existing critical alert is recovered.
- Using metrics for monitoring the resources and generating alerts when the threshold values are breached.
- Application cannot control monitoring pause/resume actions based on above alerts.
- Macro replacement limitation (i.e, customization of threshold breach alert subject, description).
- No support of showing activity log and applied time.
- No support for the option to get Latest snapshot metric.