Apps and integrations are how you would describe the necessary configuration that a gateway collector should use to authenticate itself, discover and monitor various types of IT assets in your environment. Since each distinct asset class in your environment is unique and requires unique configuration, OpsRamp allows you to onboard only those IT assets of interest to you.
Configure and Install Integrations
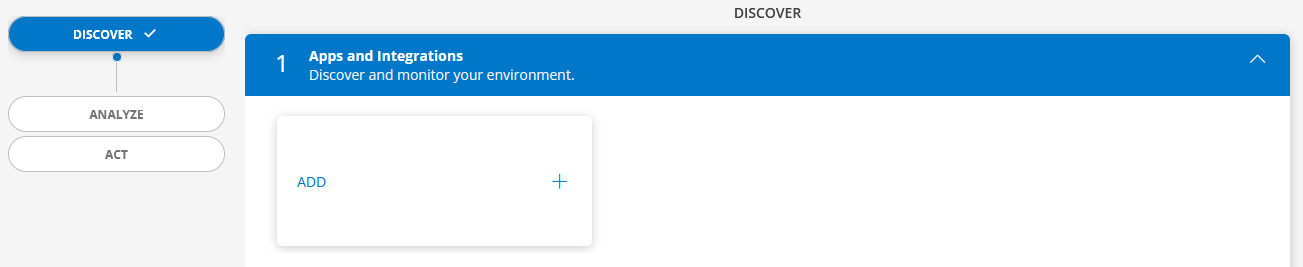
For the first-time login, the following screen is displayed under Apps and Integrations.
Follow these steps to configure and install an integration:
Click ADD. The Available Integrations and Apps page is displayed with all the available integrations.
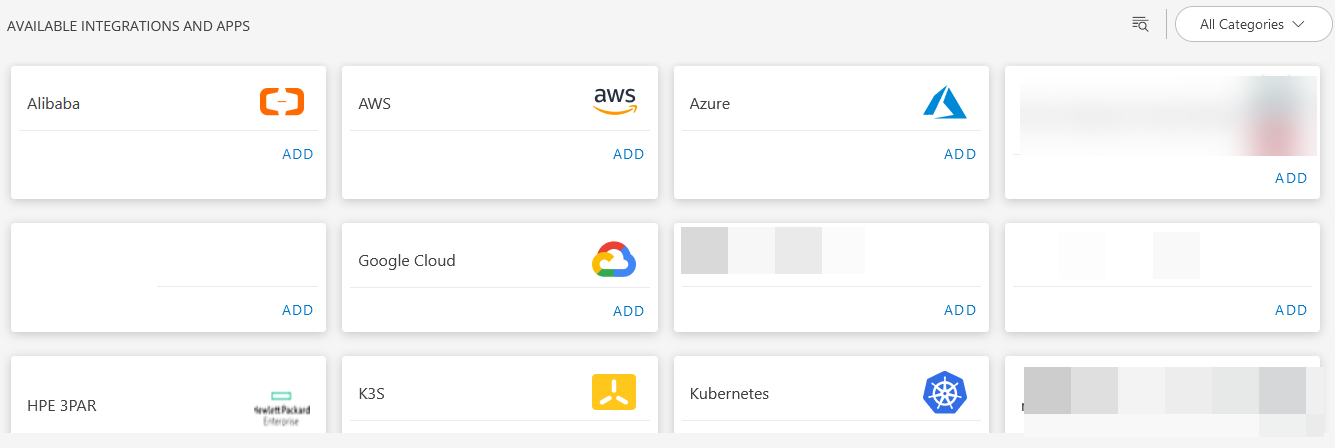
Search for the integration using the Search option.
Alternatively click the All Categories drop-down located in the upper-right corner, and then select the appropriate category.Click ADD on the tile.
Follow the steps to configure the integration. Note that the configuration steps for each integration may vary:
- Name: Configuration name
- IP Address: IP Address of the vCenter
- CredentialSet: You can select a credential from the list or to add a credential, follow the below steps:
- Click the +ADD option available in the CredentialSet dropdown. The ADD CREDENTIAL window is displayed.
Enter the following information:- Name: Credential name.
- Description: Brief description of the credential.
- User Name: User name. If you use a domain account to access vCenter, specify the domain with the username in the format
domain\username. - Password: Password of the vCenter
- Confirm Password: Confirm password
- Port: Port of the vCenter. Set
443for a secure connection. - Secure: Select the Secure checkbox for encryption.
- Connection Timeout (ms): Timeout in milliseconds.
- Click ADD to add the credential to the credential list.
- Click the +ADD option available in the CredentialSet dropdown. The ADD CREDENTIAL window is displayed.
vCenter Plug-ins Configurations (optional): Enable the vSAN checkbox.
FILTER BY RESOURCE TAG: Click Any or All of the rules below to match any one or all of the conditions you define for filtering.
Enter/select the values in the Key, Operator, and Value fields for filtering the resources.FILTER BY RESOURCE TYPE:
ALL: All the existing and future resources will be discovered.
SELECT: You can select one or multiple resources to be discovered.PERFORM ACTIONS: Select the Manage Device option, if you want the discovered devices to be managed.
DISCOVERY SCHEDULE: Discovery is triggered based on the scheduled time. New resources added to the environment are automatically discovered.
Choose one of the following Recurrence Patterns:- Hourly
- Daily
- Weekly
- Monthly
- None (On-demand discovery)
Click NEXT.
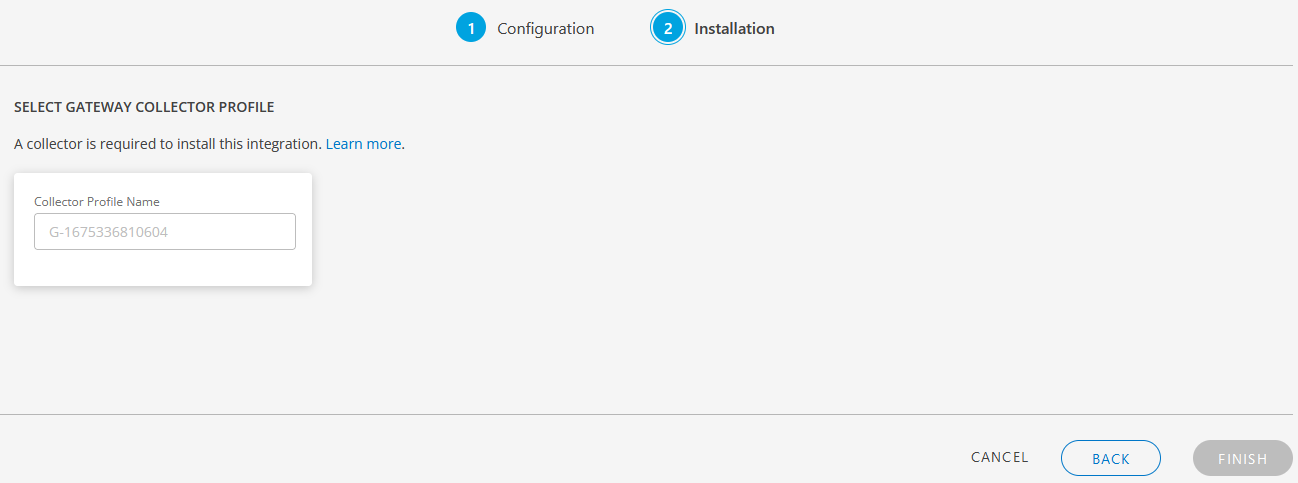
- Enter the collector profile name.
- The Installation page displays a list of existing collector profiles, if collector profiles have been installed already.
- Select a gateway collector profile.
- If you want to add a new gateway collector profile, click ADD option available at the upper-right corner of the page, and then enter the collector profile name.
- Click FINISH.
The integration is installed and displayed under Apps and Integrations.
Note
Based on the integration type, the steps to configure and install will vary.Actions on an Installed App
Click the three dots on the right side of the installed app and perform the following actions:
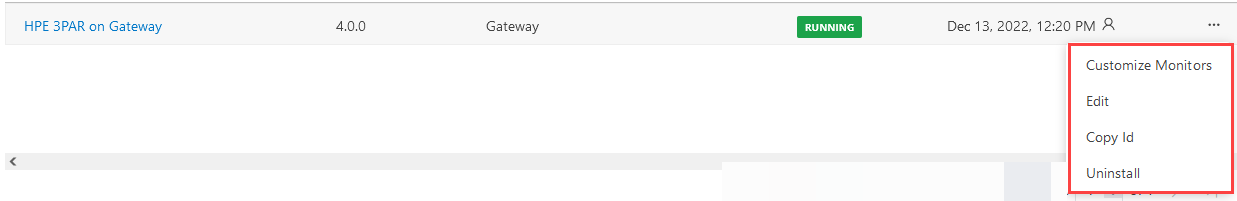
- Customize Monitors: This option helps you to quickly modify the alerting thresholds, enable alerting for the metrics, and mark the metrics for availability computation.
- Edit: This option allows you to edit the configuration.
- Uninstall: The App will be uninstalled. The uninstall action on an integration will impact the metrics, resources, alerts, and incidents that depend on the integration, and is not reversible.
- Copy Id: This option allows you to copy the installed App Id.
- Rescan: This option allows you to rescan and discover the resources.
Note
Based on the integration type, the options for each app may vary.Customize Monitors
Monitoring customization helps you to quickly modify the alerting thresholds, enable alerting for the metrics, and mark the metrics for availability computation. The improved flow for monitoring customization is achieved from the INSTALLED INTEGRATIONS page as described below.
Follow these steps to customize monitors:
Click on the installed App.
The integration will show the list of installed apps.
Click the three dots on the right side of installed apps.
Click Customize Monitors from the popup. The Customize Monitors page is displayed, along with the list of applicable monitors for the respective integration, on the left hand side.
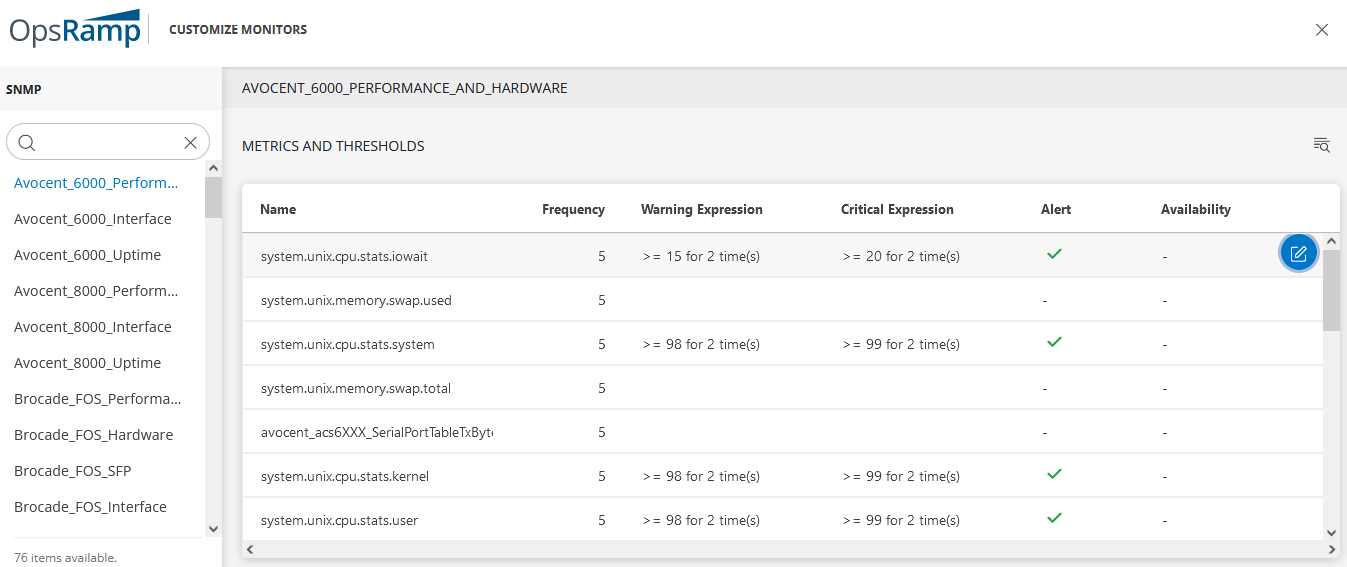
Click on the required monitor. The list of metrics will be displayed on the right hand side.
Hover over the metric and click on the Edit icon.
A popup window will be displayed.
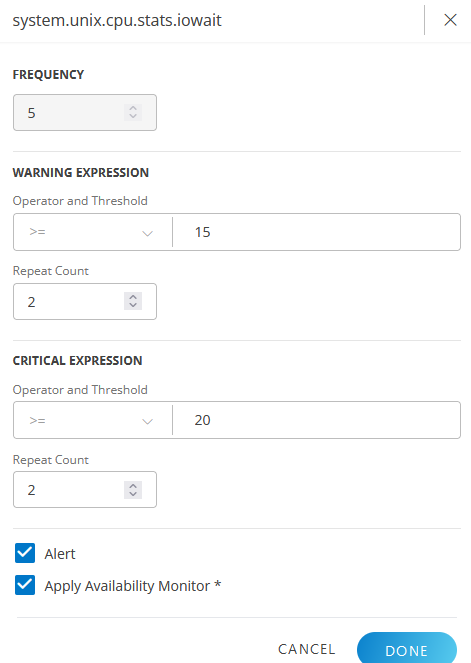
Modify the thresholds for the metrics as per the requirement: Select the warning operator and enter a value for the warning threshold and the Repeat Count. Follow this step for the critical expression.
To receive alerts on a resource metric, select the Alert check box. To know the state of a resource, select the Apply Availability Monitor check box.
Click DONE.
Click SAVE to save the changes.
Following is a table that has information about the parameters in the metric popup: Note: The parameters in the metric popup may vary based on the App.
| Parameter | Description |
|---|---|
| Frequency | It is the rate at which the Gateway collector checks the metric data. Frequency is defined in minutes (mins). |
| Warning Threshold | If the metric value meets the defined warning threshold and the operator condition, then a notification is sent to the user. |
| Critical Threshold | If the metric value meets the defined critical threshold and the operator condition, then a notification is sent to the user. |
| Repeat Count | It indicates the number of times the Repeat Frequency action should be performed. Example: If the Repeat Frequency is defined as 1 (mins) and Repeat Count is set to 3, it means whenever the CPU utilization is equal to or greater than the threshold value, the agent repeats capturing the CPU utilization details for the next three minutes. |
| Alert | To receive alerts on a resource metric, select the Alert check box. |
| Availability Monitor | To know the state of a resource, select the Apply Availability Monitor check box. |
Modify an Installed Integration or Application
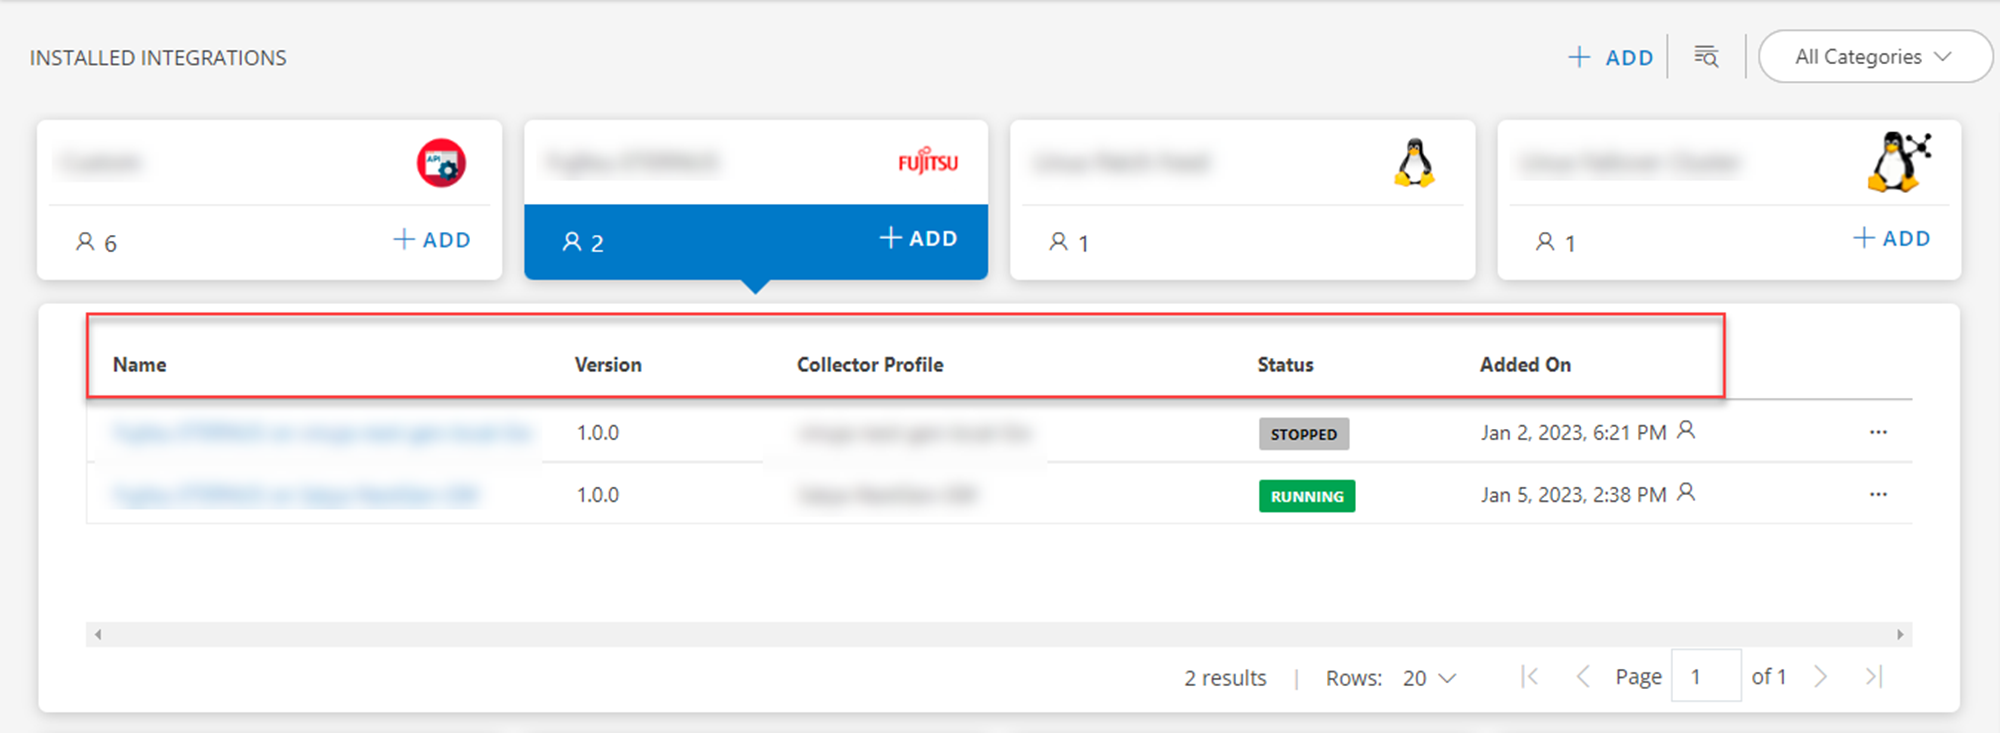
Click the name of the integration or application. A list of configurations is displayed with the following information:
Name - Displays the name of the integration or application.
Version - Displays the version details of the integration.
Collector Profile - Displays the name of the collector profile.
Status - Displays the status of the collector profile. The status is a combination of both the gateway and application. Example: If the gateway status is up and the application status is installed, then the status is shown as Running.
Note: The following statuses are applicable to SNMP, Linux, and discovery apps/integrations.
Gateway Status Application Status Installed Enabled Up Running Running Down Stopped Stopped Not Installed/Deployed/Registered Configured Configured - Added On - Displays the date and time details of the added integration or application. The user icon next to the time indicates the user who added the application.
The following options are available when you click the action icon (three dots):
- Edit: To edit an integration, click this button.
- Copy Id: To copy an integration id, click this button.
- Uninstall: To uninstall an integration, click this button.
Note: Based on the integration type, the options for each app may vary.

Edit an integration
- Click Edit from the three dots or click the name of the integration. The Configurations page is displayed with a list of available configurations specific to the selected integration.
- Click the three dots available for the configuration and click Edit.
- In the Edit Configuration window that appears, edit the configuration and click Update.
Copy an integration id
- Click the three dots available for the integration and click Copy Id. The integration id is copied.
Uninstall an integration
Click the three dots available for the integration and click Uninstall.
In the Uninstall Integration window that appears, mention the reason for uninstalling and click UNINSTALL. The configuration is uninstalled.
Note: When you uninstall an integration, the resources associated with all configurations are also deleted.
Modify a configuration
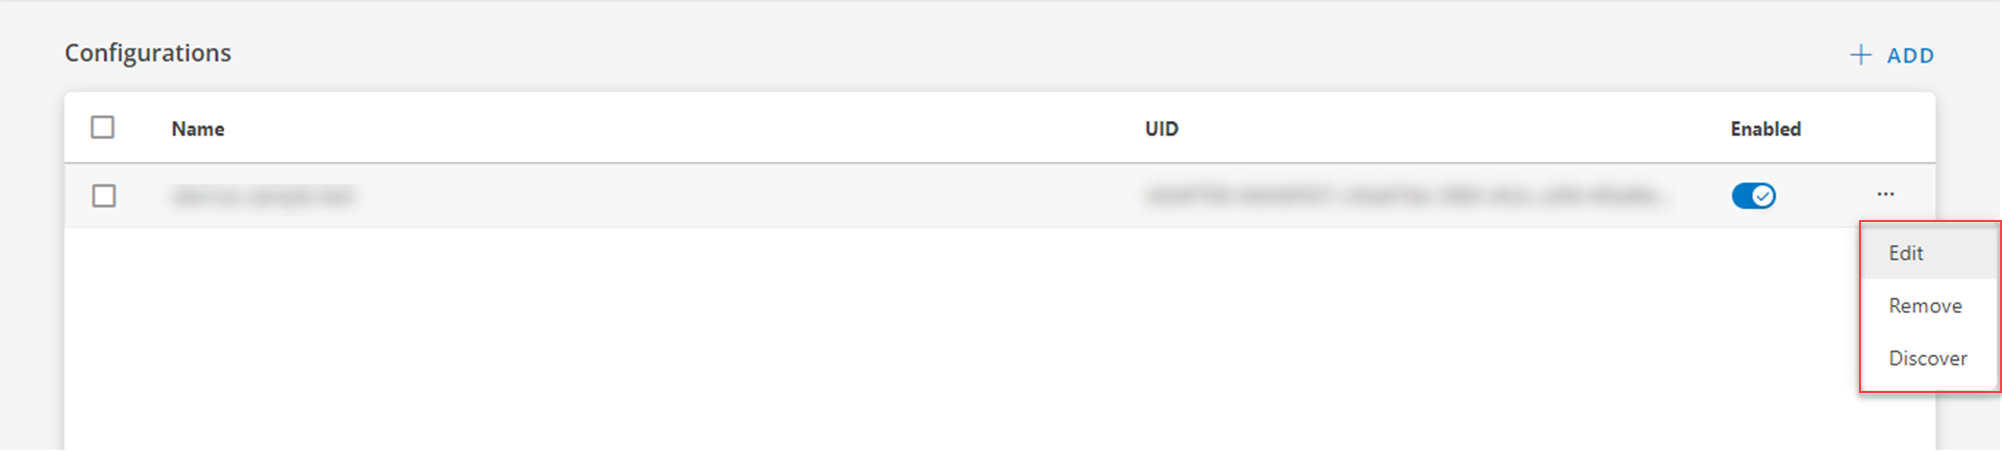
Configurations are available for each integration. The following actions can be performed on the configurations from the three dots next to each configuration:
- Edit: To edit a configuration, click this button.
- Remove: To remove a configuration, click this button.
- Discover: To discover a configuration, click this button.
Edit a configuration
Click Edit from the three dot menu of a configuration.
In the Edit Configuration window, edit the configuration and click Update.
Notes:
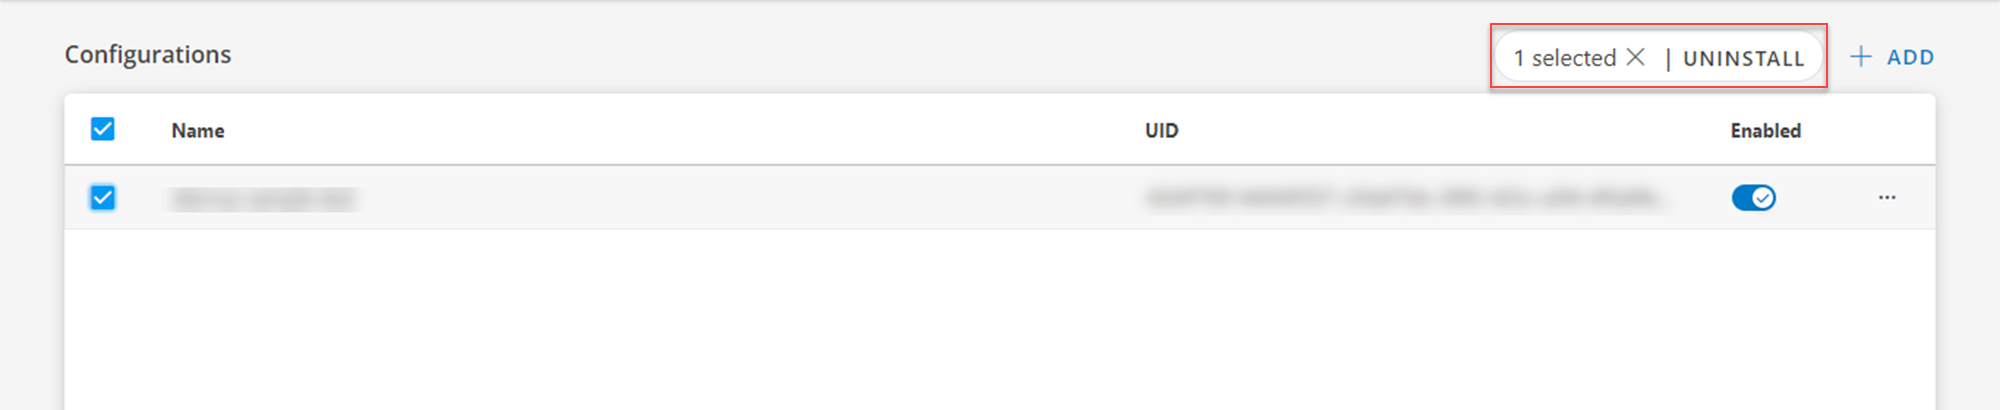
- You may also uninstall multiple configurations at the same time. Select configurations from the list in the Edit page and click UNINSTALL at the top right.
- You may also add a new configuration from the Edit page by clicking + ADD.
Remove a configuration
Click Remove from the three dots of a configuration that you want to remove. A confirmation message appears.
Click Delete to remove the configuration. Click Cancel to go back.
Note: When you remove a configuration, the resources associated with that configuration are also deleted.
Discover a configuration
- Click the three dot menu available for the configuration and click Discover. A discovery is initiated and the status is displayed under the Discovery status column.